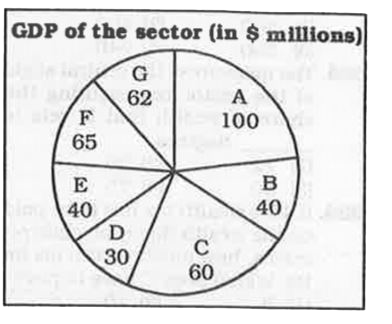
The pie chart shows the contribution of all the sectors towards the GDP of the economy of a certain country. Study the diagram and answer the following questions.
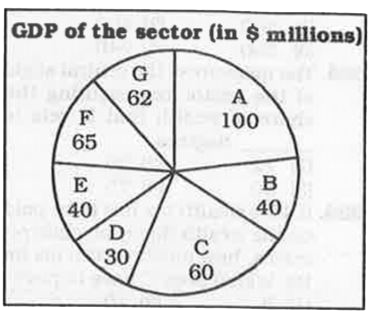
The measure of the central angle of the sector representing D is ____ degrees.
30
36
45
60
The correct Answer is:A
Step by step video, text & image solution for The pie chart shows the contribution of all the sectors towards the GDP of the economy of a certain country. Study the diagram and answer the following questions. The measure of the central angle of the sector representing D is ____ degrees. by Maths experts to help you in doubts & scoring excellent marks in Class 14 exams.
Updated on:21/07/2023Topper's Solved these Questions
- STATISTICS AND DATA INTERPRETATIONBOOK - KIRAN PUBLICATIONCHAPTER - STATISTICS AND DATA INTERPRETATIONEXERCISE - TYPE-VIII
8 Videos
- STATISTICS AND DATA INTERPRETATIONBOOK - KIRAN PUBLICATIONCHAPTER - STATISTICS AND DATA INTERPRETATIONEXERCISE - TYPE-VI
86 Videos
- SIMPLIFICATIONBOOK - KIRAN PUBLICATIONCHAPTER - SIMPLIFICATIONEXERCISE - TEST YOURSELF
25 Videos
- TIME AND DISTANCEBOOK - KIRAN PUBLICATIONCHAPTER - TIME AND DISTANCEEXERCISE - Type -XI
74 Videos
Similar Questions
The pie chart shows the contribution of all the sectors towards the GDP of the economy of a certain country. Study the diagram and answer the following questions.
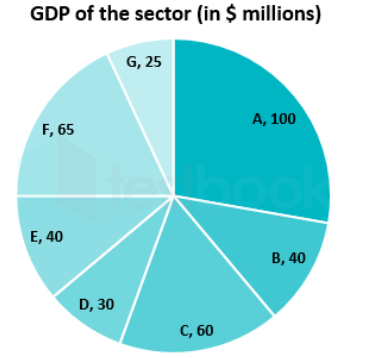
Which sector has made the second highest contribution?
View SolutionThe pie chart shows the value of the total annual agricultural production of a country. Study the diagram and answer the following questions.
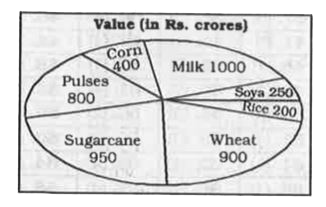
The measured of the central angle of the sector representing the production of milk is ____ degrees.
View Solution
Knowledge Check
The pie chart shows the contribution of all the sectors towards the GDP of the economy of a certain country. Study the diagram and answer the following questions.
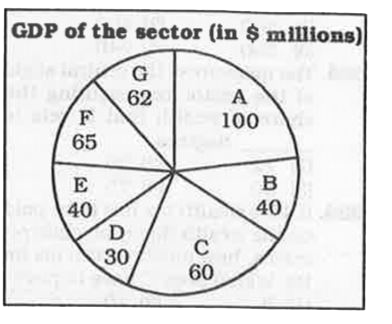
What is the total GDP of the country (in $ million)?A400B450C360D300The pie chart shows the contribution of all the sectors towards the GDP of the economy of a certain country. Study the diagram and answer the following questions.
Which sector has made the second highest contribution?AABCCDDFThe pie chart shows the contribution of all the sectors towards the GDP of the economy of a certain country. Study the diagram and answer the following questions.
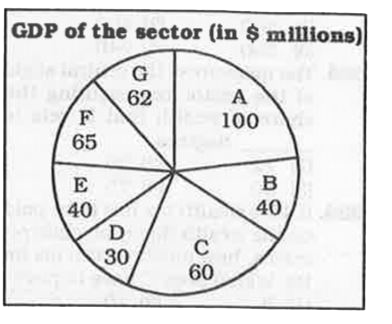
If in the following year sectors A, B and C grew by 9% and the remaining sectors grew by 3%, how much did the overall economy grow by?A6.33%B5.55%C5%D7%
The pie chart shows the breakup of expenditure of a college for the year 2017. Study the diagram and answer the following questions.
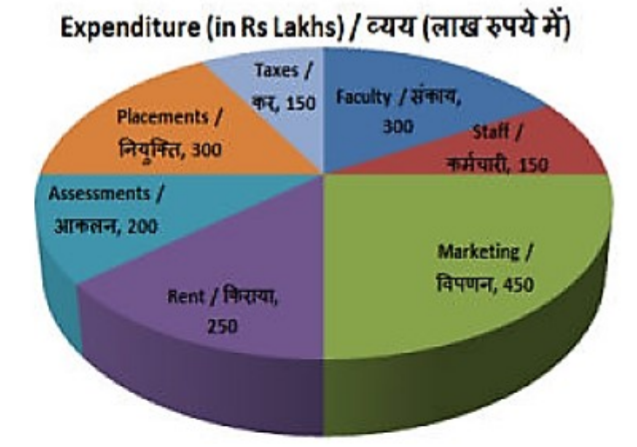
The measure of the central angle of the sector representing Faculty is ________ degrees.
View SolutionThe pie chart shows the value of the total annual agricultural production of a country. Study the diagram and answer the following questions.

The measured of the central angle of the sector representing the production of milk is ____ degrees.
View SolutionThe pie chart shows the breakup of expendoture of a software company for the year 2017. Study the diagram and answer the following questions.
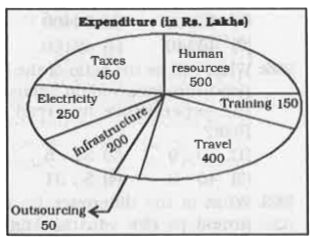
The measure of the central angle of the sector representing Taxes is ____ degrees.
View SolutionThe pie chart shows the breakup of expendoture of a manufacturing company for the year 2017. Study the diagram and answer the following questions.
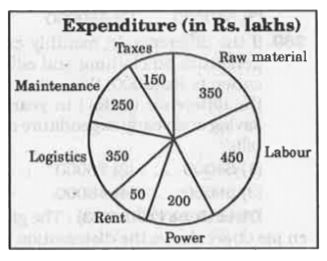
The measure of the central angle of the sector representing Taxes is ____ degrees.
View SolutionThe pie chart shows the results of an online survey which asked people about their favorite game. Study the diagram and answer the following questions.

The measure of the central angle of the sector representing Baseball is ________ degrees.
View Solution
