Study the following frequency polygon and answer the questions.
Given a line graph showing the number of students passed in Higher Secondary Examination in a school over the years 2008 to 2013.
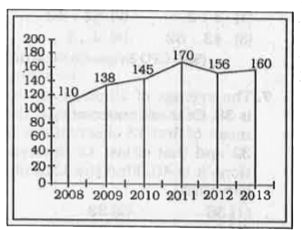
The decrease in percentage of passed students from 2011 to 2012 approximately is
8.25%
8.27%
8.24%
8.22%
The correct Answer is:C
Step by step video, text & image solution for Study the following frequency polygon and answer the questions. Given a line graph showing the number of students passed in Higher Secondary Examination in a school over the years 2008 to 2013. The decrease in percentage of passed students from 2011 to 2012 approximately is by Maths experts to help you in doubts & scoring excellent marks in Class 14 exams.
Topper's Solved these Questions
- BOOK - KIRAN PUBLICATIONCHAPTER - STATISTICS AND DATA INTERPRETATIONEXERCISE - TYPE-VII363videos
STATISTICS AND DATA INTERPRETATION
- BOOK - KIRAN PUBLICATIONCHAPTER - SIMPLIFICATIONEXERCISE - TEST YOURSELF25videos
SIMPLIFICATION
- BOOK - KIRAN PUBLICATIONCHAPTER - TIME AND DISTANCEEXERCISE - Type -XI74videos
TIME AND DISTANCE
Similar Questions
Study the following bar graph and answer the questions given below.
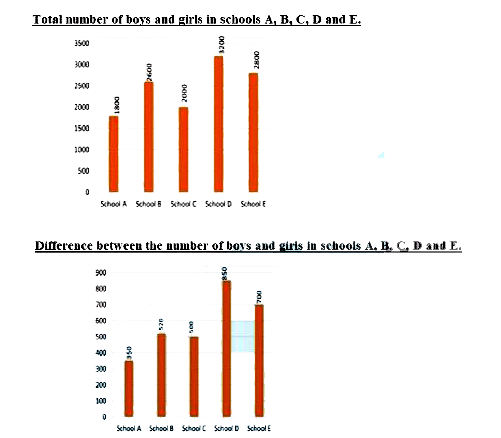
The number of boys in school B is what percentage of the total number of students in that school ?View SolutionStudy the following frequency polygon and answer the questions. Given a line graph showing the number of students passed in Higher Secondary Examination in a school over the years 2008 to 2013:
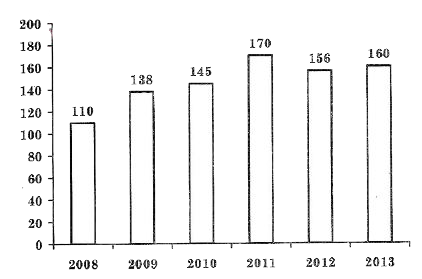
The average of passed students in the years 2008, 2009, 2012 approximately is.
निम्नलिखित बारम्बारता बहुभुज का अध्ययन करें और दिए गए प्रश्नों के उत्तर दें। नीचे रेखा ग्राफ में एक स्कूल में वर्ष 2008 से 2018 तक के वर्षों में उच्चतर माध्यमिक परीक्षा में उत्तीर्ण होने वाले विद्यार्थियों की संख्या दर्शायी गई है :
वर्ष 2008, 2009, 2012 में उत्तीर्ण होने वाले विद्यार्थियों की संख्या का औसत लगभग क्या था?View Solution
Knowledge Check
- Question 1 - Select One
Study the following frequency polygon and answer the questions.
Given a line graph showing the number of students passed in Higher Secondary Examination in a school over the years 2008 to 2013.
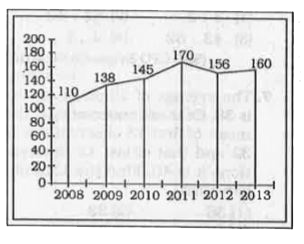
The increase in percentage of passed students from 2008 to 2011 approximately isAa)55%Bb)50.5%Cc)54.5%Dd)53.05% - Question 2 - Select One
Study the following frequency polygon and answer the questions. Given a line graph showing the number of students passed in Higher Secondary Examination in a school over the years 2008 to 2013:
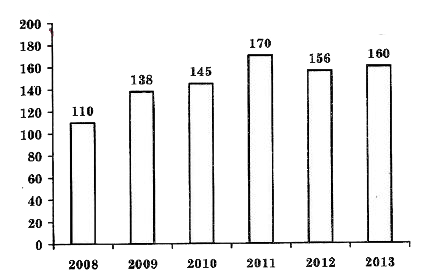
The increase in percentage of passed students from 2008 to 2011 approximately is.
निम्नलिखित बारम्बारता बहुभुज का अध्ययन करें और दिए गए प्रश्नों के उत्तर दें। नीचे रेखा ग्राफ में एक स्कूल में वर्ष 2008 से 2018 तक के वर्षों में उच्चतर माध्यमिक परीक्षा में उत्तीर्ण होने वाले विद्यार्थियों की संख्या दर्शायी गई है :
वर्ष 2008 से 2011 तक उत्तीर्ण होने वाले विद्यार्थियों की प्रतिशतता में लगभग कितनी वृद्धि हुई है?A0.55B0.545C0.505D0.5305 - Question 3 - Select One
Study the following frequency polygon and answer the questions.
Given a line graph showing the number of students passed in Higher Secondary Examination in a school over the years 2008 to 2013.
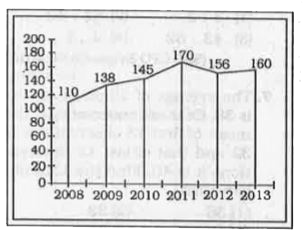
The average of passed students in the years 2008, 2009, 2012 approximately isA134.32B134.41C134.56D134.67
Study the following graph carefully and answer the questions that follow
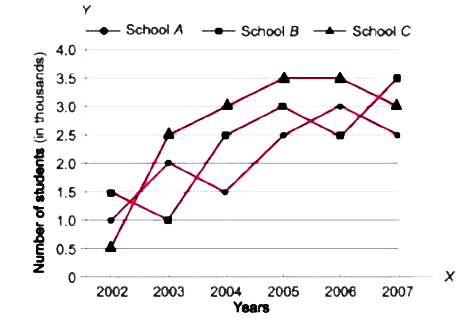
What was the average number of students in all schools together in the year 2006 ?View SolutionStudy the following graph carefully and answer the questions given below. The number of students who joined and left the school in the beginning of year for six years from 2003 to 2008. (Initial Strength of the school is 2000)
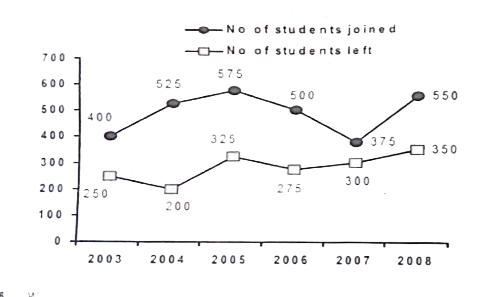
The number of students in 2006 is approximately what percent of the number of student in 2004 ?View SolutionStudy the following table carefully to answer these questions ---
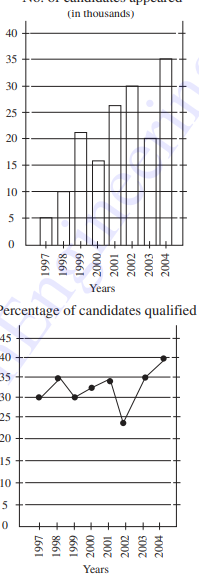
What is the average approximate number of passed students in 1998 all states ?View SolutionStudy the following graph carefully and answer the questions that follow
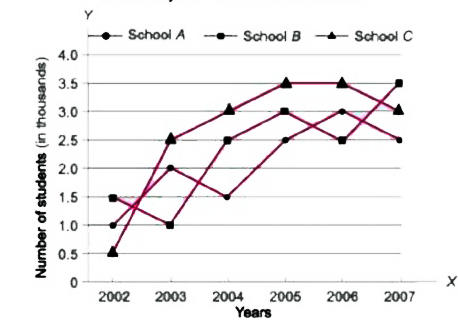
What was the approximate average number of students in school A over all the years together ?View SolutionRead the following table carefully and answer the questions given below.

If the number of students appeared from school C in each year is 4800, what is the average number of passed students from school C in all the years ?View Solution

