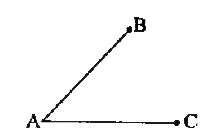
Name the line segments in fig. 4.2. Is A, the end point of each line segment?
 Solution in Punjabi
Step by step video & image solution for Name the line segments in fig. 4.2. Is A, the end point of each line segment? by Maths experts to help you in doubts & scoring excellent marks in Class 6 exams.
Updated on:21/07/2023Topper's Solved these Questions
- BASIC GEOMETRICAL IDEAS BOOK - NAND LAL PUBLICATIONCHAPTER - BASIC GEOMETRICAL IDEAS EXERCISE - DO THIS
5 Videos
- BASIC GEOMETRICAL IDEAS BOOK - NAND LAL PUBLICATIONCHAPTER - BASIC GEOMETRICAL IDEAS EXERCISE - THINK DISCUSS AND WRITE
1 Videos
- BASIC GEOMETRICAL IDEAS BOOK - NAND LAL PUBLICATIONCHAPTER - BASIC GEOMETRICAL IDEAS EXERCISE - SAMPLE PAPER FOR PRACTICE
18 Videos
- ALGEBRABOOK - NAND LAL PUBLICATIONCHAPTER - ALGEBRAEXERCISE - SAMPLE PAPER FOR PRACTICE
26 Videos
- DECIMALSBOOK - NAND LAL PUBLICATIONCHAPTER - DECIMALSEXERCISE - TRY THESE
13 Videos
Similar Questions
Take a sheet of paper. Make two folds (and crease them).to represent intersecting lines and discuss.
Can two lines intersect in more than one point?
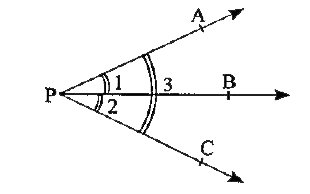
View SolutionLook at the fig. (4.18). What is the name of the angle? Shall we say ∠P? But then which one do you mean? By ∠P what do we mean?

View SolutionIf lines l and m intersect at a point Also m and n intersect at a point, is it necessary that lines l,m,n intersect at the same point.
View SolutionCoefficient of the variable in the expression 3−2x2 is
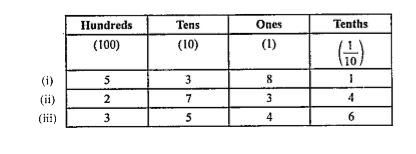
View SolutionCan you write the following as decimals?

View SolutionHow many lines of symmetry does the above figure have ?
View SolutionDetermine the point of symmetry of a regular hexagon.
View SolutionDtermine the images of the following figure about the given line :
View SolutionMatch the following Column A to Column B

View SolutionMatch the following Column A to Column B

View SolutionMatch the following Column A to Column B

View SolutionThe inequation represented by the graph given below is :
View SolutionThe inequation that best describes the graph given below is _________
View SolutionThe inequation that best describes the following graph is _________
View SolutionIn Fig, find the value of x.
ltimg src="https://d10lpgp6xz60nq.cloudfront.net/physics_images/PS_MATH_IX_C12_S01_032_Q01.png" width="80%"gt
View SolutionThe equation of straight line shown in figure is :
ltimg src="https://d10lpgp6xz60nq.cloudfront.net/physics_images/ALN_PHY_R04_E01_020_Q01.png" width="80%"gt
View Solution
