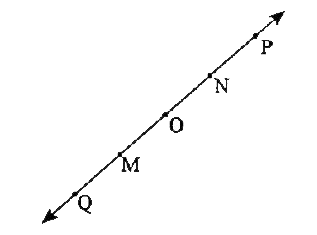
Consider the following figure of line −−−→MN. Say whether following statements are true or false in context of the given figure.

M is one of the end points of the line segment −−→QO Solution in Punjabi
Step by step video & image solution for Consider the following figure of line vec(MN). Say whether following statements are true or false in context of the given figure. M is one of the end points of the line segment vec(QO) by Maths experts to help you in doubts & scoring excellent marks in Class 6 exams.
Updated on:21/07/2023Topper's Solved these Questions
- BASIC GEOMETRICAL IDEAS BOOK - NAND LAL PUBLICATIONCHAPTER - BASIC GEOMETRICAL IDEAS EXERCISE - EXERCISE 4.2
8 Videos
- BASIC GEOMETRICAL IDEAS BOOK - NAND LAL PUBLICATIONCHAPTER - BASIC GEOMETRICAL IDEAS EXERCISE - EXERCISE 4.3
7 Videos
- BASIC GEOMETRICAL IDEAS BOOK - NAND LAL PUBLICATIONCHAPTER - BASIC GEOMETRICAL IDEAS EXERCISE - THINK DISCUSS AND WRITE
1 Videos
- ALGEBRABOOK - NAND LAL PUBLICATIONCHAPTER - ALGEBRAEXERCISE - SAMPLE PAPER FOR PRACTICE
26 Videos
- DECIMALSBOOK - NAND LAL PUBLICATIONCHAPTER - DECIMALSEXERCISE - TRY THESE
13 Videos
Similar Questions
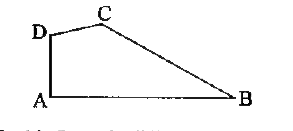
Classify the following curves as (i) open or (ii) closed:

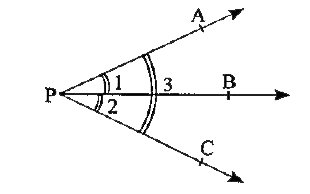
View SolutionName the angles in the given figure.

View SolutionLook at the fig. (4.18). What is the name of the angle? Shall we say ∠P? But then which one do you mean? By ∠P what do we mean?

View SolutionCoefficient of the variable in the expression 3−2x2 is
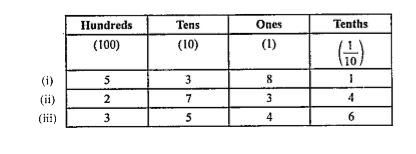
View SolutionCan you write the following as decimals?

View SolutionHow many lines of symmetry does the above figure have ?
View SolutionDetermine the point of symmetry of a regular hexagon.
View SolutionDtermine the images of the following figure about the given line :
View SolutionMatch the following Column A to Column B

View SolutionThe inequation represented by the graph given below is :
View SolutionThe inequation that best describes the graph given below is _________
View SolutionThe inequation that best describes the following graph is _________
View SolutionWhich inequations represent the shaded region in the given figure
View SolutionThe equation of straight line shown in figure is :
ltimg src="https://d10lpgp6xz60nq.cloudfront.net/physics_images/ALN_PHY_R04_E01_020_Q01.png" width="80%"gt
View SolutionConsider the following figure of line MN.Say whether following statements are true or false in context of the given gifure.
O and N are end points of line segment¯¯¯¯¯¯QO.
View SolutionConsider the following figure of line MN.Say whether following statements are true or false in context of the given gifure.
M is point on ray −−→OP.
View Solution
