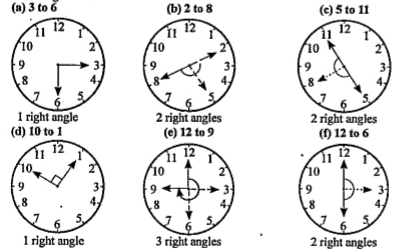
Find the number of right angles turned through by the hour hand of a clock when it goes from
 Solution in Punjabi
Step by step video & image solution for Find the number of right angles turned through by the hour hand of a clock when it goes from by Maths experts to help you in doubts & scoring excellent marks in Class 6 exams.
Updated on:21/07/2023Topper's Solved these Questions
- UNDERSTANDING ELEMENTARY SHAPES BOOK - NAND LAL PUBLICATIONCHAPTER - UNDERSTANDING ELEMENTARY SHAPES EXERCISE - EXERCISE - 5.3
2 Videos
- UNDERSTANDING ELEMENTARY SHAPES BOOK - NAND LAL PUBLICATIONCHAPTER - UNDERSTANDING ELEMENTARY SHAPES EXERCISE - EXERCISE - 5.4
19 Videos
- UNDERSTANDING ELEMENTARY SHAPES BOOK - NAND LAL PUBLICATIONCHAPTER - UNDERSTANDING ELEMENTARY SHAPES EXERCISE - EXERCISE - 5.1
7 Videos
- SYMMETRYBOOK - NAND LAL PUBLICATIONCHAPTER - SYMMETRYEXERCISE - SAMPLE PAPER FOR PRACTICE
8 Videos
- WHOLE NUMBERS BOOK - NAND LAL PUBLICATIONCHAPTER - WHOLE NUMBERS EXERCISE - SAMPLE PAPER FOR PRACTICE
16 Videos
Similar Questions
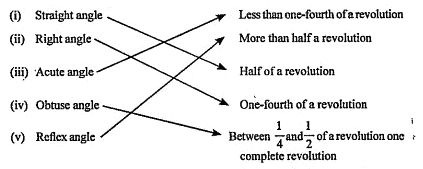
Match the following.

View SolutionWhat is the measure of
a right angle?
View SolutionWhat is the disadvantage of comparing line segments by mere observation?
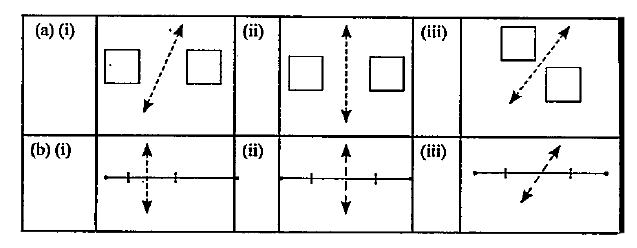
View SolutionWhich of the two figures are the images of each other ( mirror line is the dotted line )

View SolutionThe difference between the successor and predecessor of a number is
View SolutionDetermine the point of symmetry of a regular hexagon.
View SolutionDtermine the images of the following figure about the given line :
View SolutionMatch the following Column A to Column B

View SolutionMatch the following Column A to Column B

View SolutionMatch the following Column A to Column B

View SolutionFind the area of figure given below.

View SolutionFind the perimeter of the figure given below.

View SolutionFind the area of the figure given below.

View SolutionThe inequation represented by the graph given below is :
View SolutionThe inequation that best describes the graph given below is _________
View SolutionThe inequation that best describes the following graph is _________
View Solution
