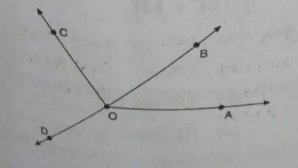
Measure and classify each angle,
 Solution in Punjabi
Step by step video & image solution for Measure and classify each angle, by Maths experts to help you in doubts & scoring excellent marks in Class 6 exams.
Updated on:21/07/2023Topper's Solved these Questions
- UNDERSTANDING ELEMENTARY SHAPES BOOK - NAND LAL PUBLICATIONCHAPTER - UNDERSTANDING ELEMENTARY SHAPES EXERCISE - EXERCISE - 5.5
12 Videos
- UNDERSTANDING ELEMENTARY SHAPES BOOK - NAND LAL PUBLICATIONCHAPTER - UNDERSTANDING ELEMENTARY SHAPES EXERCISE - EXERCISE - 5.6
17 Videos
- UNDERSTANDING ELEMENTARY SHAPES BOOK - NAND LAL PUBLICATIONCHAPTER - UNDERSTANDING ELEMENTARY SHAPES EXERCISE - EXERCISE - 5.3
2 Videos
- SYMMETRYBOOK - NAND LAL PUBLICATIONCHAPTER - SYMMETRYEXERCISE - SAMPLE PAPER FOR PRACTICE
8 Videos
- WHOLE NUMBERS BOOK - NAND LAL PUBLICATIONCHAPTER - WHOLE NUMBERS EXERCISE - SAMPLE PAPER FOR PRACTICE
16 Videos
Similar Questions
Which of the following are models for perpendicular line:
(i)The adjacent edges of a table top.
(ii)The lines of a railway track.
(iii) The letter V
View SolutionName the types of the following triangles.
Triangle with lengths of sides 8 cm, 8 cm and 9 cm.
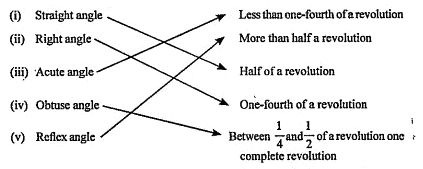
View SolutionMatch the following.

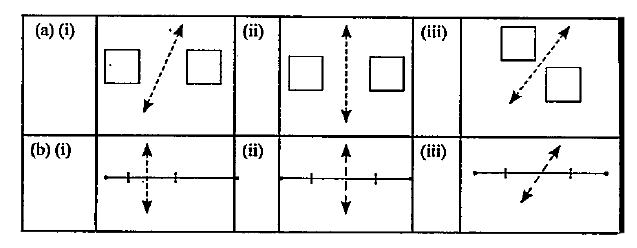
View SolutionWhich of the two figures are the images of each other ( mirror line is the dotted line )

View SolutionThe difference between the successor and predecessor of a number is
View SolutionHow many lines of symmetry does the above figure have ?
View SolutionWhich of the following are correct chain isomers of butane ? (i)
View SolutionDetermine the point of symmetry of a regular hexagon.
View SolutionDtermine the images of the following figure about the given line :
View SolutionMatch the following Column A to Column B

View SolutionMatch the following Column A to Column B

View SolutionMatch the following Column A to Column B

View SolutionFind the area of the figure given below.

View SolutionThe area of the shaded part in the figure given below is ______.

View SolutionThe inequation represented by the graph given below is :
View SolutionThe inequation that best describes the graph given below is _________
View Solution
