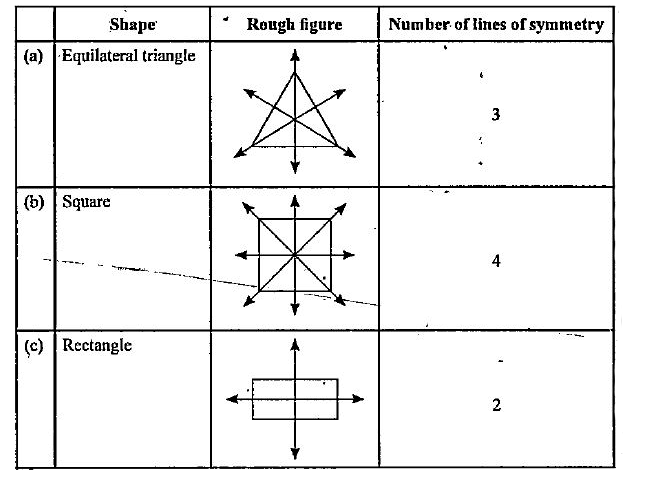
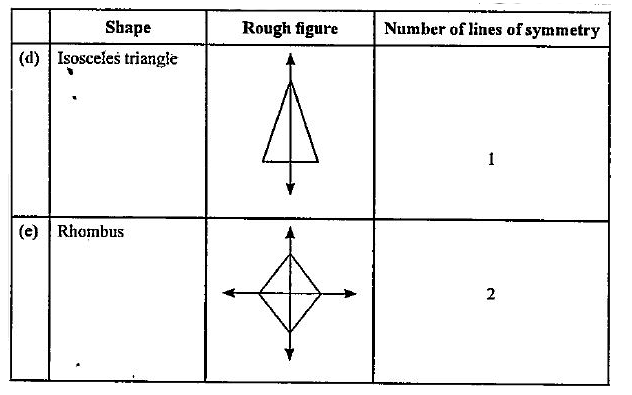
Complete the following table .

 Solution in Punjabi
Step by step video & image solution for Complete the following table . by Maths experts to help you in doubts & scoring excellent marks in Class 6 exams.
Updated on:21/07/2023Topper's Solved these Questions
- SYMMETRYBOOK - NAND LAL PUBLICATIONCHAPTER - SYMMETRYEXERCISE - ADDITIONAL QUESTIONS FOR PRACTICE (Very Short Answer type Questions )
19 Videos
- SYMMETRYBOOK - NAND LAL PUBLICATIONCHAPTER - SYMMETRYEXERCISE - ADDITIONAL QUESTIONS FOR PRACTICE (Long Short Answer type Questions )
3 Videos
- SYMMETRYBOOK - NAND LAL PUBLICATIONCHAPTER - SYMMETRYEXERCISE - Exercise - 13.1
7 Videos
- RATIO AND PROPORTION BOOK - NAND LAL PUBLICATIONCHAPTER - RATIO AND PROPORTION EXERCISE - SAMPLE PAPER FOR PRACTICE
13 Videos
- UNDERSTANDING ELEMENTARY SHAPES BOOK - NAND LAL PUBLICATIONCHAPTER - UNDERSTANDING ELEMENTARY SHAPES EXERCISE - SAMPLE PAPER FOR PRACTICE (Fill in the blanks)
6 Videos
Similar Questions
When a line divides the given figure into two identical halves then the line is called .
View SolutionCan you draw a quadrilateral having
(a) no line of symmetry
(b) 2 lines of symmetry
View SolutionList any four symmetrical objects from your home or school.
View SolutionFind the number which has the same ratio to 32 as 18 has to 24?
View SolutionA tetrahedron has ______faces.
View SolutionMatch the following lists:

View SolutionHow many lines of symmetry does the above figure have ?
View SolutionWhich of the following are correct chain isomers of butane ? (i)
View SolutionDetermine the point of symmetry of a regular hexagon.
View SolutionDtermine the images of the following figure about the given line :
View SolutionMatch the following Column A to Column B

View SolutionMatch the following Column A to Column B

View SolutionMatch the following Column A to Column B

View SolutionThe inequation represented by the graph given below is :
View SolutionThe inequation that best describes the graph given below is _________
View SolutionThe inequation that best describes the following graph is _________
View Solution
