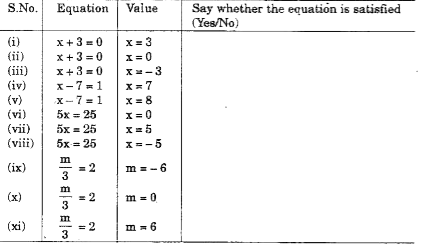
Complete the last column of the table
 Solution in Punjabi
Step by step video & image solution for Complete the last column of the table by Maths experts to help you in doubts & scoring excellent marks in Class 7 exams.
Updated on:21/07/2023Topper's Solved these Questions
- SIMPLE EQUATIONSBOOK - NAND LAL PUBLICATIONCHAPTER - SIMPLE EQUATIONSEXERCISE - EXERCISE 4.2
32 Videos
- SIMPLE EQUATIONSBOOK - NAND LAL PUBLICATIONCHAPTER - SIMPLE EQUATIONSEXERCISE - EXERCISE 4.3
22 Videos
- SIMPLE EQUATIONSBOOK - NAND LAL PUBLICATIONCHAPTER - SIMPLE EQUATIONSEXERCISE - SAMPLE PAPER FOR PRACTICE
23 Videos
- RATIONAL NUMBERS BOOK - NAND LAL PUBLICATIONCHAPTER - RATIONAL NUMBERS EXERCISE - SAMPLE PAPER FOR PRACTICE
24 Videos
- SYMMETRY BOOK - NAND LAL PUBLICATIONCHAPTER - SYMMETRY EXERCISE - SAMPLE PAPER FOR PRACTICE (Answer the following :)
9 Videos
Similar Questions
Give first the step you will use to separate the variable and then solve the equation:
x-1 = 0
View SolutionSolve the following equations:
2y+52=372
View SolutionFill in the blanks
For a given solution the number of equations that can be formed are ...........
View SolutionFill in the blanks
Standard form of 72−144 is…….
View SolutionWhat is the other name for lines of symmetry for
(i) Isosceles triangle
(ii) Circle
View SolutionHow many lines of symmetry does the above figure have ?
View SolutionWhich of the following are correct chain isomers of butane ? (i)
View SolutionDetermine the point of symmetry of a regular hexagon.
View SolutionDtermine the images of the following figure about the given line :
View SolutionMatch the following Column A to Column B

View SolutionMatch the following Column A to Column B

View SolutionMatch the following Column A to Column B

View SolutionThe inequation represented by the graph given below is :
View SolutionThe inequation that best describes the graph given below is _________
View SolutionThe inequation that best describes the following graph is _________
View SolutionWhich inequations represent the shaded region in the given figure
View Solution
