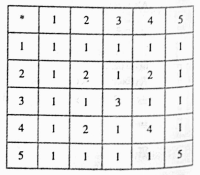
Consider a binary operation * on the set (1,2,3,4,5) given by the adjoining operation table.
 Is * commutaive ?Solution in Punjabi
Step by step video & image solution for Consider a binary operation * on the set (1,2,3,4,5) given by the adjoining operation table. Is * commutaive ? by Maths experts to help you in doubts & scoring excellent marks in Class 12 exams.
Updated on:21/07/2023Topper's Solved these Questions
- RELATIONS AND FUNCTIONSBOOK - PRADEEP PUBLICATIONCHAPTER - RELATIONS AND FUNCTIONSEXERCISE - EXERCISE
401 Videos
- PROBABILITYBOOK - PRADEEP PUBLICATIONCHAPTER - PROBABILITYEXERCISE - EXERCISE
467 Videos
- THREE DIMENSIONAL GEOMETRYBOOK - PRADEEP PUBLICATIONCHAPTER - THREE DIMENSIONAL GEOMETRYEXERCISE - EXERCISE
373 Videos
Similar Questions
Let A = (a,b,c) and R be the relation defined on A as follows R = (a,a), (b,c), (a,b) Write minimum number of ordered pairs to be added to R to make R reflexive and transitive.
View SolutionA dice is rolled twice in succession. Find the probability of a number greater than 4 on each throw.
View SolutionFind the points on z-axis which are at a distance of √21 from the point (1,2,3).
View SolutionDetermine the point of symmetry of a regular hexagon.
View SolutionDtermine the images of the following figure about the given line :
View SolutionMatch the following Column A to Column B

View SolutionMatch the following Column A to Column B

View SolutionMatch the following Column A to Column B

View SolutionFind the area of figure given below.

View SolutionFind the perimeter of the figure given below.

View SolutionFind the area of the figure given below.

View SolutionCalculate the volume of the given solid.
ltimg src="https://d10lpgp6xz60nq.cloudfront.net/physics_images/PS_MATH_VII_C06_E03_002_Q01.png" width="80%"gt
View SolutionThe area of the shaded part in the figure given below is ______.

View SolutionThe inequation represented by the graph given below is :
View SolutionThe inequation that best describes the graph given below is _________
View SolutionThe inequation that best describes the following graph is _________
View Solution
