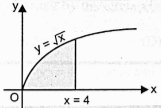
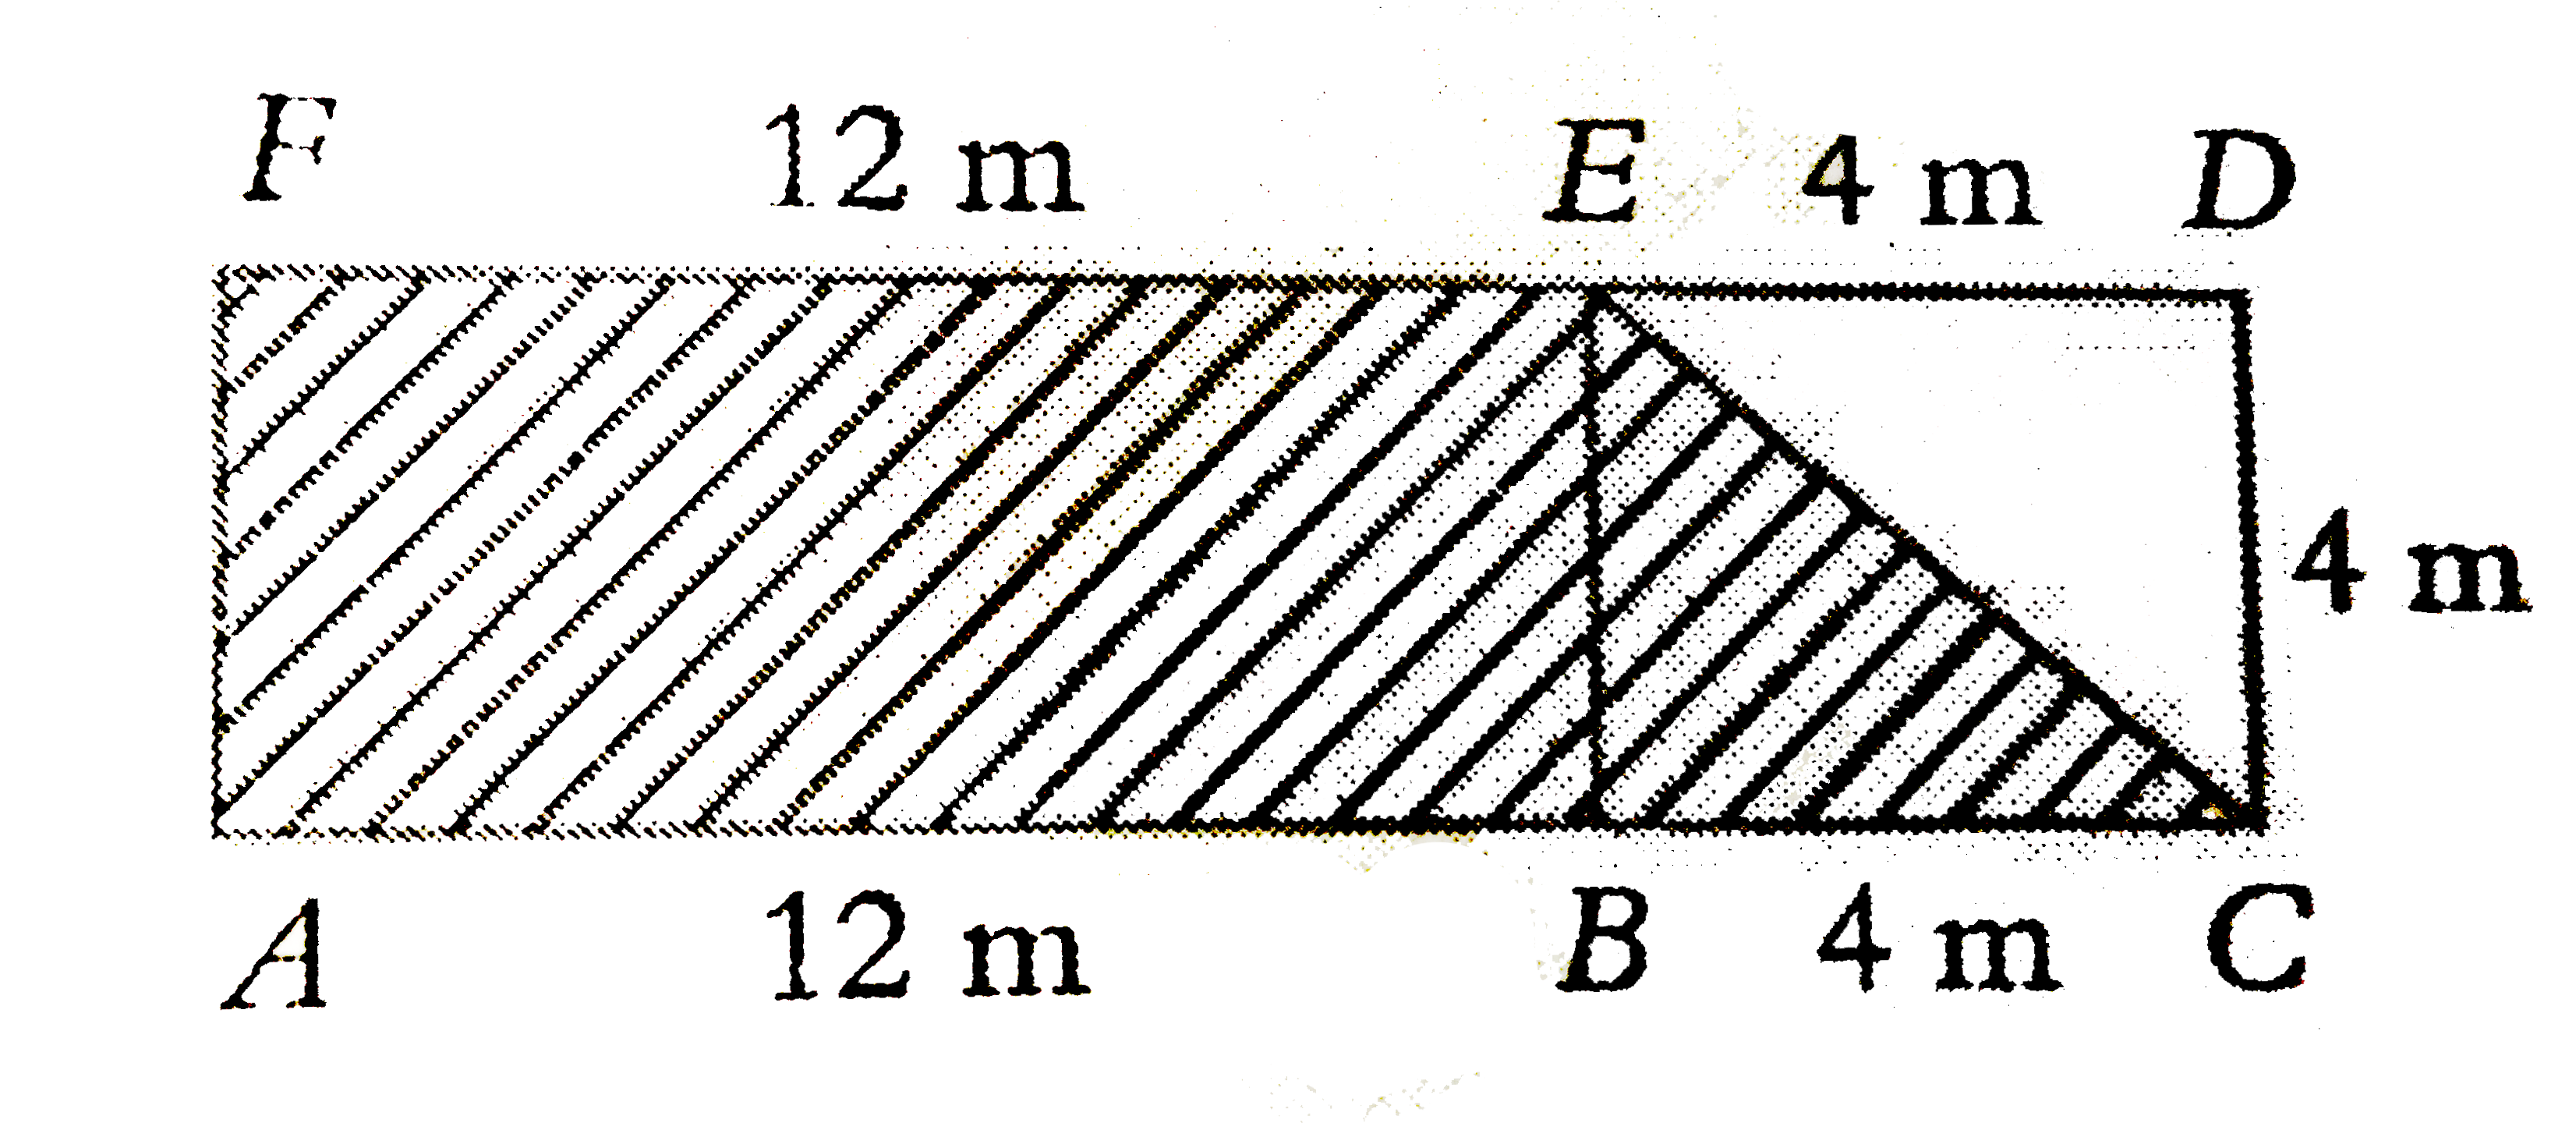
Compute the area shown shaded in the figure.
 Solution in Punjabi
Step by step video & image solution for Compute the area shown shaded in the figure. by Maths experts to help you in doubts & scoring excellent marks in Class 12 exams.
Topper's Solved these Questions
- BOOK - PRADEEP PUBLICATIONCHAPTER - APPLICATIONS OF INTEGRALSEXERCISE - EXERCISE162videos
APPLICATIONS OF INTEGRALS
- BOOK - PRADEEP PUBLICATIONCHAPTER - APPLICATIONS OF DERIVATIVESEXERCISE - EXERCISE502videos
APPLICATIONS OF DERIVATIVES
- BOOK - PRADEEP PUBLICATIONCHAPTER - CONTINUITY AND DIFFERENTIABILITYEXERCISE - EXERCISE788videos
CONTINUITY AND DIFFERENTIABILITY
Similar Questions
Using integration, find the region bounded by the line 2y=-x+8, x-axis, and the lines x=2 and x=4.
01:37View SolutionThe length x of a rectangle is decreasign at the rate of 5 cm/min and the width y is incresaing at the rate of 4cm/min. when x = 8 cm and y = 6 cm, find the rates of change of the area of the rectangle.
02:11View SolutionExamine the continuity of f(x)={x2−9x−3x≠36x=3 at x = 3
01:31View SolutionHow many lines of symmetry does the above figure have ?
02:45View SolutionDetermine the point of symmetry of a regular hexagon.
02:17View SolutionDtermine the images of the following figure about the given line :
05:41View SolutionMatch the following Column A to Column B
 03:28View Solution
Match the following Column A to Column B
 02:21View Solution
Match the following Column A to Column B
 02:03View Solution
Find the area of figure given below.
 02:12View Solution
Find the area of the figure given below.
 02:10View Solution
The area of the shaded part in the figure given below is ______.
 02:17View Solution
Find the area of the shaded part in the figure given above.02:10View SolutionThe inequation represented by the graph given below is :
04:23View SolutionThe inequation that best describes the graph given below is _________
01:59View SolutionThe inequation that best describes the following graph is _________
01:19View Solution

