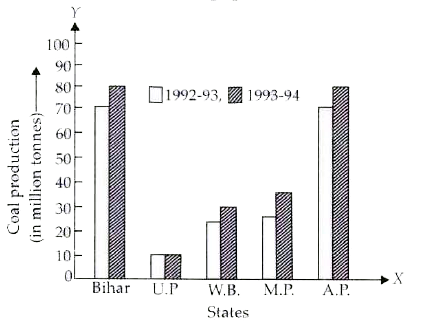
Read the following bar graph given in figure and answer the following questions.
Name the state having same production in both the years?
Step by step video, text & image solution for Read the following bar graph given in figure and answer the following questions. Name the state having same production in both the years? by Maths experts to help you in doubts & scoring excellent marks in Class 9 exams.
Updated on:21/07/2023Topper's Solved these Questions
- STATISTICSBOOK - MTG IIT JEE FOUNDATIONCHAPTER - STATISTICSEXERCISE - NCERT SECTION (Exercise 14.1)
2 Videos
- STATISTICSBOOK - MTG IIT JEE FOUNDATIONCHAPTER - STATISTICSEXERCISE - NCERT SECTION (Exercise 14.2)
15 Videos
- STATISTICSBOOK - MTG IIT JEE FOUNDATIONCHAPTER - STATISTICSEXERCISE - Olympiad/HOTS Corner
20 Videos
- QUADRILATERALS BOOK - MTG IIT JEE FOUNDATIONCHAPTER - QUADRILATERALS EXERCISE - Olympiad/HOTS CORNER
15 Videos
- TRIANGLESBOOK - MTG IIT JEE FOUNDATIONCHAPTER - TRIANGLESEXERCISE - OLYMPAID/ HOTS CORNER
10 Videos
Similar Questions
Knowledge Check
Study the following bar graph and answer the question that follows.
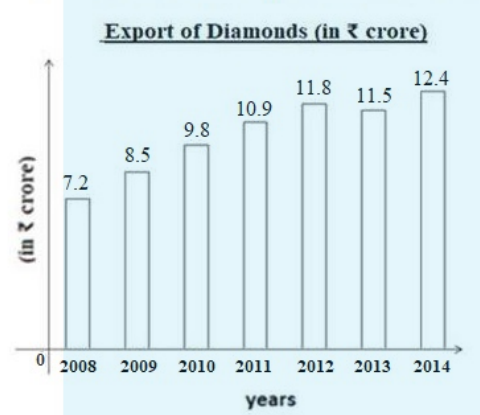
In which year was the maximin percentage increase in diamonds exports compared to the previous year?A2014B2009C2010D2012
Read the following bar graph given in figure and answer the following questions.
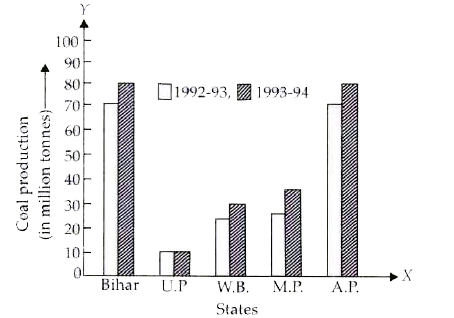
(i) What information is given by this bar graph?
View SolutionRead the following bar graph given in Figure and answer the following questions: What information is given by this bar graph? Which two states have same production in 1993-94? Name the state having same production in both the years? Which state has minimum production?
View SolutionRead the following bar graph (Figure) and answer the following questions: What information is given by the bar graph? What was the production of cement in the year 1980-81? What is the minimum and maximum productions of cement and corresponding years?
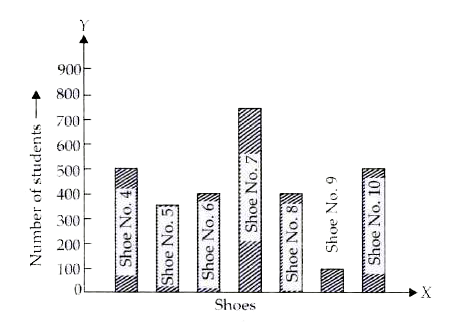
View SolutionRead the bar graph shown in figure and answer the following questions.
What is the information given by the bar graph?
View SolutionRead the following text and answer the following questions on the basis of the same:
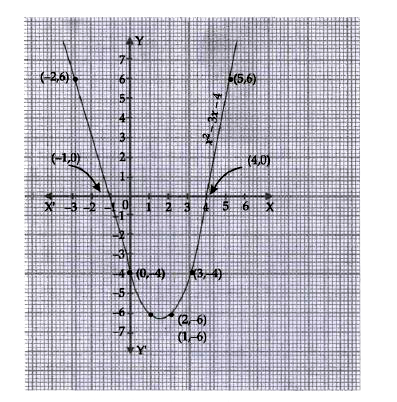
Name the shape of the graph
View SolutionRead the bar graph given below and answer the following questions:
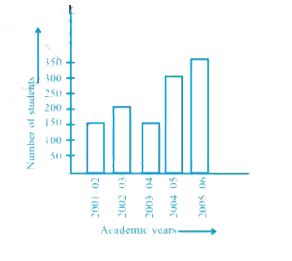
In which year is the number of students maximum?
View SolutionRead the following bar graph (Figure) and answer the following questions: What is the information given by the bar graph? State each of the following whether true or false. The number of government companies in 1957 is that of 1982 is 1:9. The number of government companies have decreased over the year 1957 to 1983.
View Solution

