The table shows the number of people visiting the 'Good-Living pavilion' in a trade fair during different times of the day.
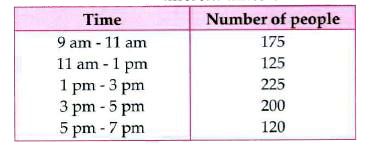
Find the probability that the randomly chosen person visited the pavilion between 9 am to 1 pm.
60/169
59/169
61/169
58/169
The correct Answer is:A
Step by step video, text & image solution for The table shows the number of people visiting the 'Good-Living pavilion' in a trade fair during different times of the day. Find the probability that the randomly chosen person visited the pavilion between 9 am to 1 pm. by Maths experts to help you in doubts & scoring excellent marks in Class 9 exams.
Updated on:21/07/2023Topper's Solved these Questions
- PROBABILITYBOOK - MTG IIT JEE FOUNDATIONCHAPTER - PROBABILITYEXERCISE - EXERCISE (MATCH THE FOLLOWING)
1 Videos
- PROBABILITYBOOK - MTG IIT JEE FOUNDATIONCHAPTER - PROBABILITYEXERCISE - EXERCISE (ASSERTION AND REASON TYPE)
5 Videos
- PROBABILITYBOOK - MTG IIT JEE FOUNDATIONCHAPTER - PROBABILITYEXERCISE - NCERT SECTION (EXERCISE 15.1)
20 Videos
- POLYNOMIALSBOOK - MTG IIT JEE FOUNDATIONCHAPTER - POLYNOMIALSEXERCISE - Olympiad/HOTS Corner
20 Videos
- QUADRILATERALS BOOK - MTG IIT JEE FOUNDATIONCHAPTER - QUADRILATERALS EXERCISE - Olympiad/HOTS CORNER
15 Videos
Similar Questions
The given table shows the number of tourists who visited Taj Mahal during different months. Month

Draw a bar graph to represent the above information by using appropriate scale.
View SolutionAn organisation selected 2400 families at random and surveyed them to determine a relationship between income level and the number of vehicles in a family. The information gathered is listed in the table below.
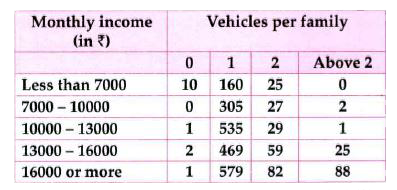
Suppose a family is chosen. Find the probability that the family chosen is
earning Rs 16000 or more per month and owning exactly 1 vehicle.
View Solution
Knowledge Check
The table shows the number of people visiting the 'Good-Living pavilion' in a trade fair during different times of the day.
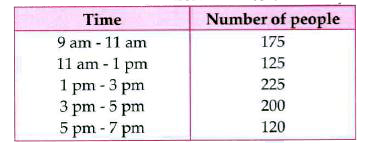
Find the probability that the randomly chosen person visited the pavilion after 1 pm but before 5 pm.A85/169B84/167C85/167D84/169The following table showing the percentage of the total population of a state in different age groups. Out of every 50,000 people, find the approximate number of persons below the age of 35?
निम्नलिखित तालिका एक राज्य में अलग-अलग आयु वर्ग की कुल आबादी के प्रतिशत को दर्शाती है |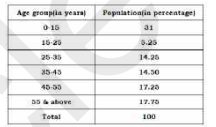
प्रत्येक 50,000 लोगों में से, 35 वर्ष से कम उम्र के लोगों की संख्या (लगभग) ज्ञात करें |A25230B26260C26250D25250
An organisation selected 2400 families at random and surveyed them to determine a relationship between income level and the number of vehicles in a family. The information gathered is listed in the table below.
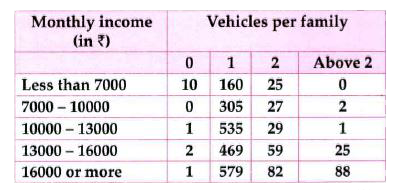
Suppose a family is chosen. Find the probability that the family chosen is
owning not more than 1 vehicle
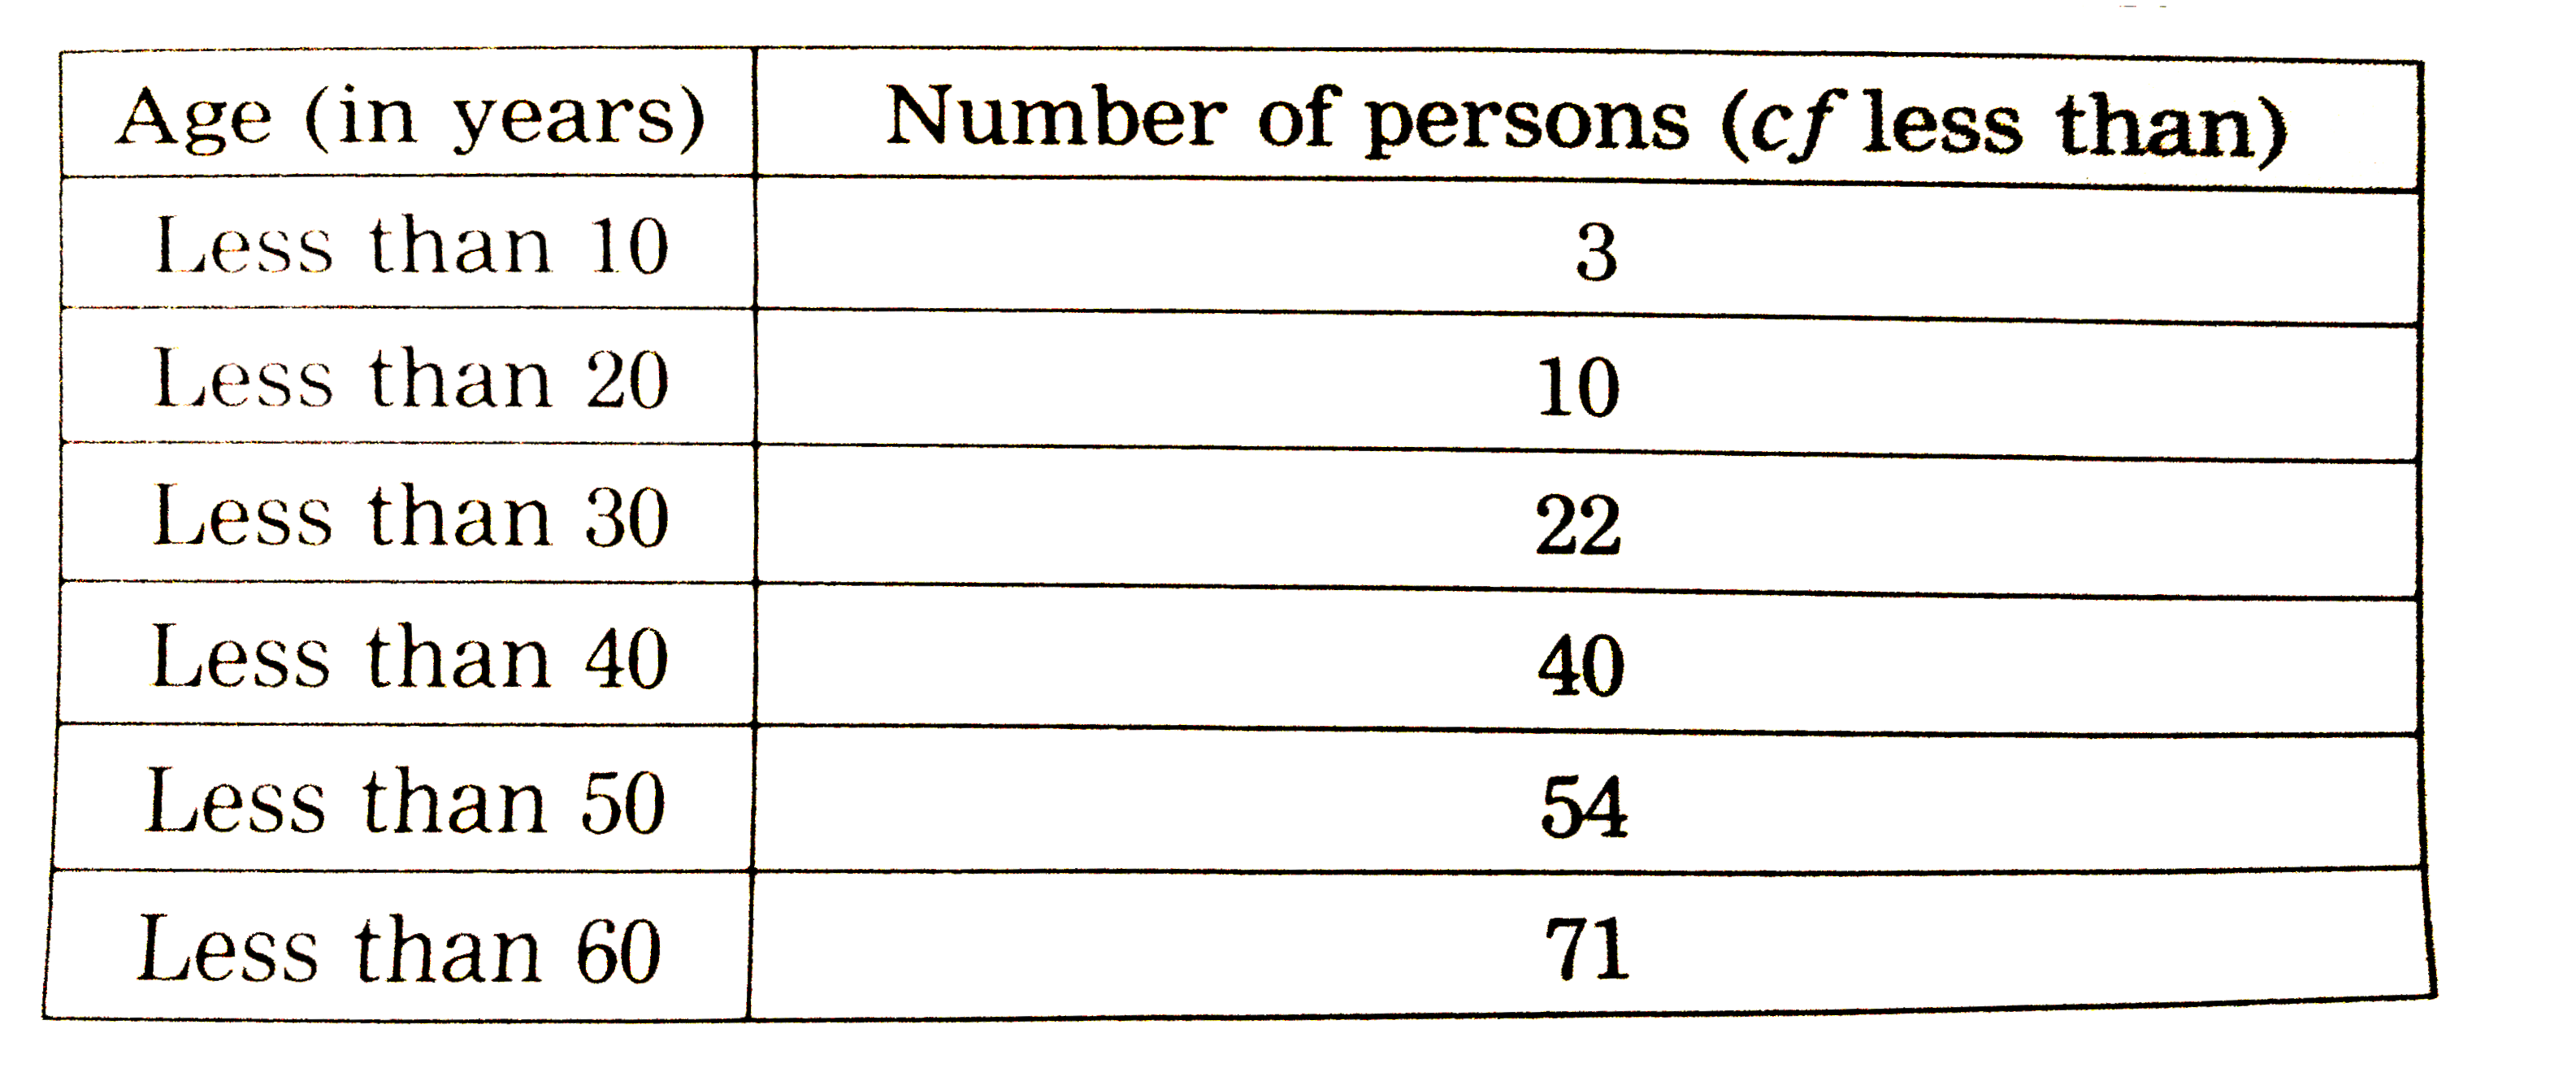
View SolutionThe following table shows the ages of persons who visited a museum on a certain day. Find the median age of the visitors.
View SolutionAn organisation selected 2400 families at random and surveyed them to determine a relationship between income level and the number of vehicles in a family . The information gathered is listed in the table below
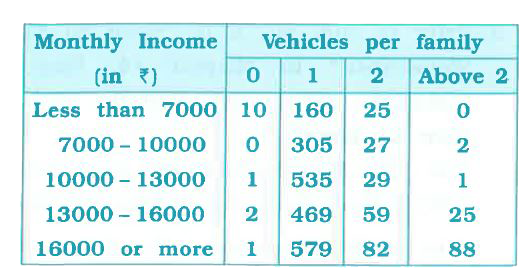
Suppose a family is chosen, Find probability that the family chosen is
earning Rs 16000 or more per month and owning exactly 1 vehicle.
View SolutionThe following table shows the number of classes taken by each Teacher in different days and the total number amount given to the Teacher per class For the certain course also given
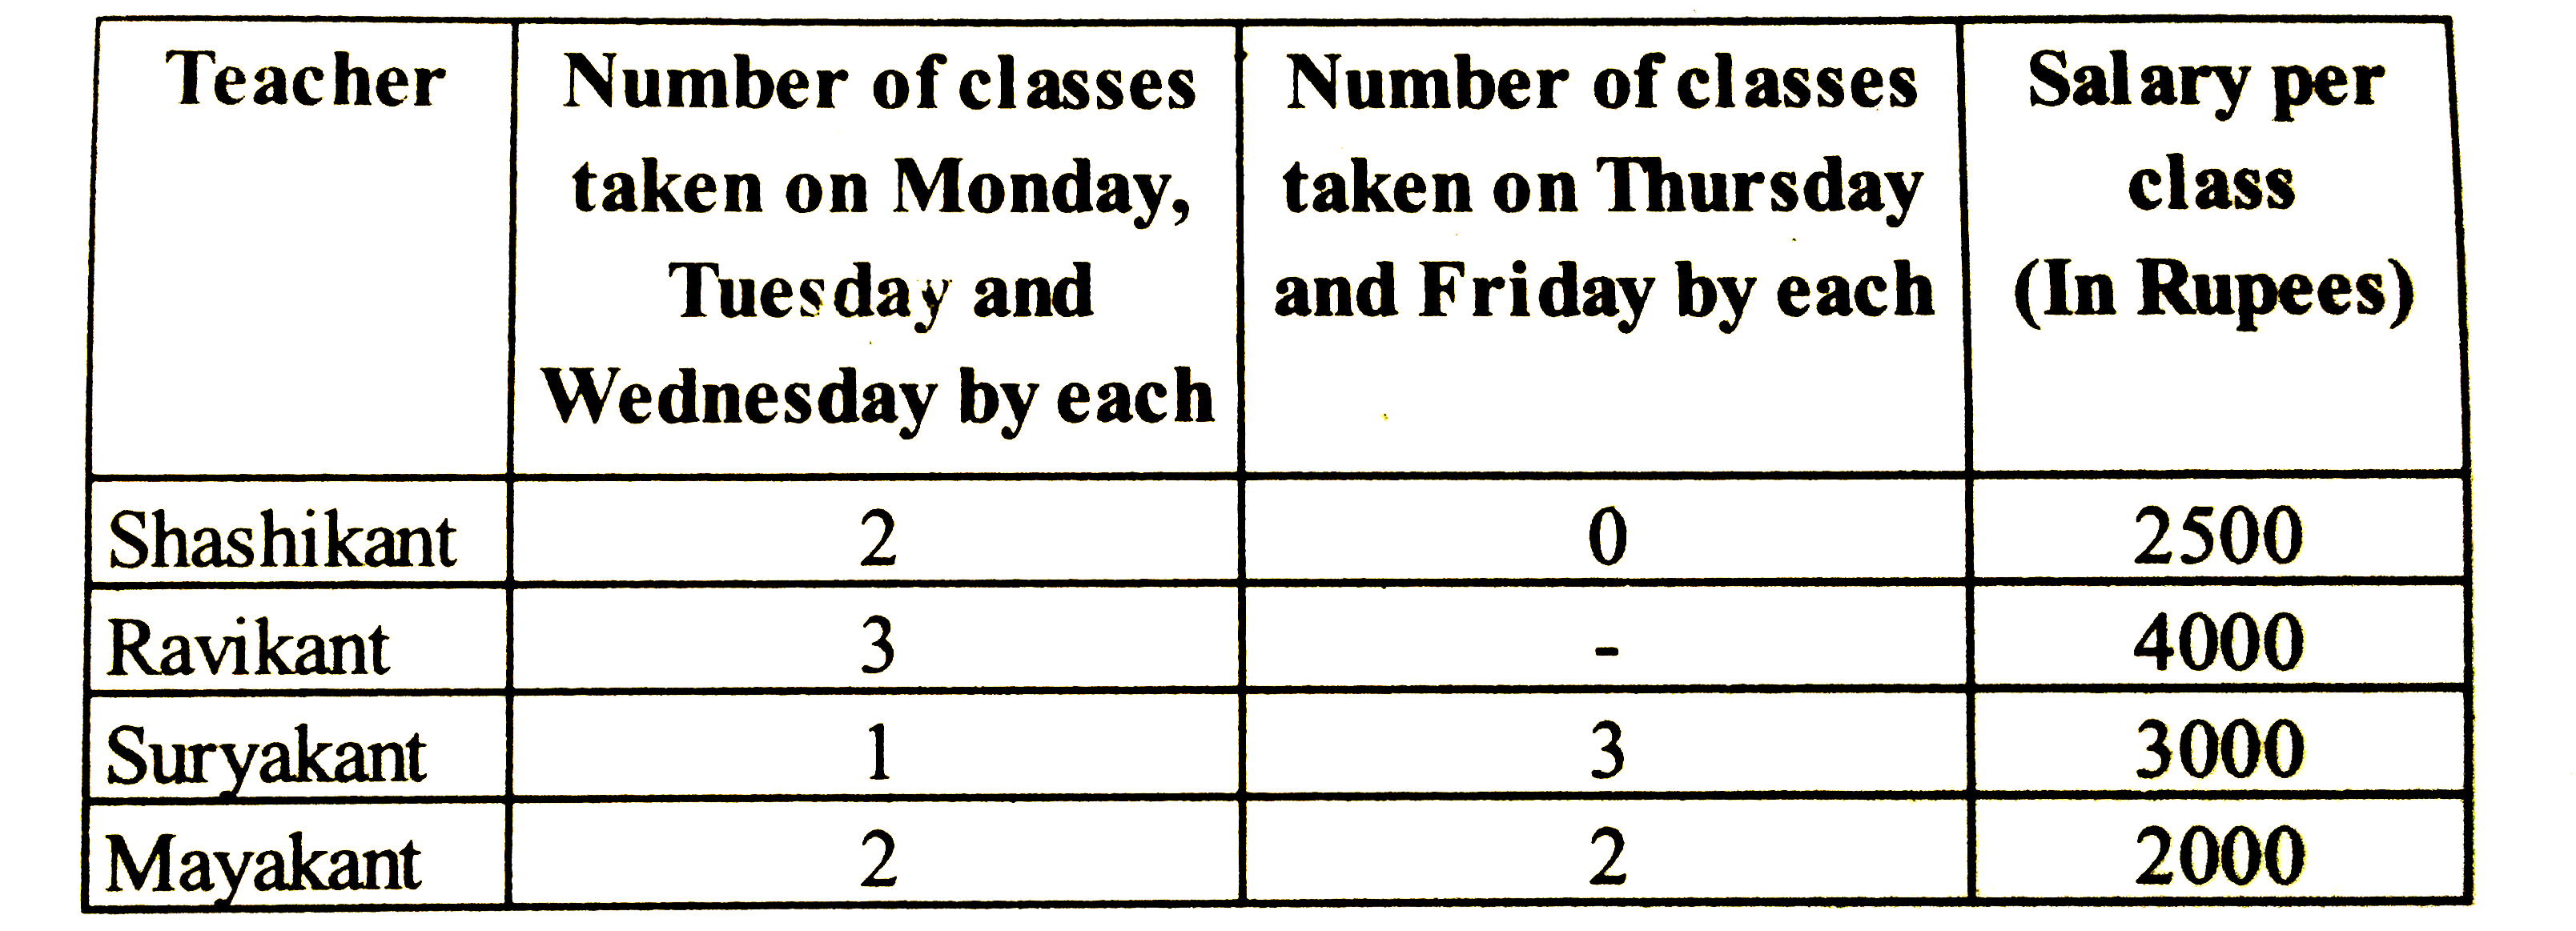
Find the differece between the earnings made by Suryakant for 3 weeks to that of the earnings made by Mayakant for 2 weeks ?
View SolutionThe following table shows the ages of persons who visited a museum on a certain day. Find the median age of the persons visitng the museum.
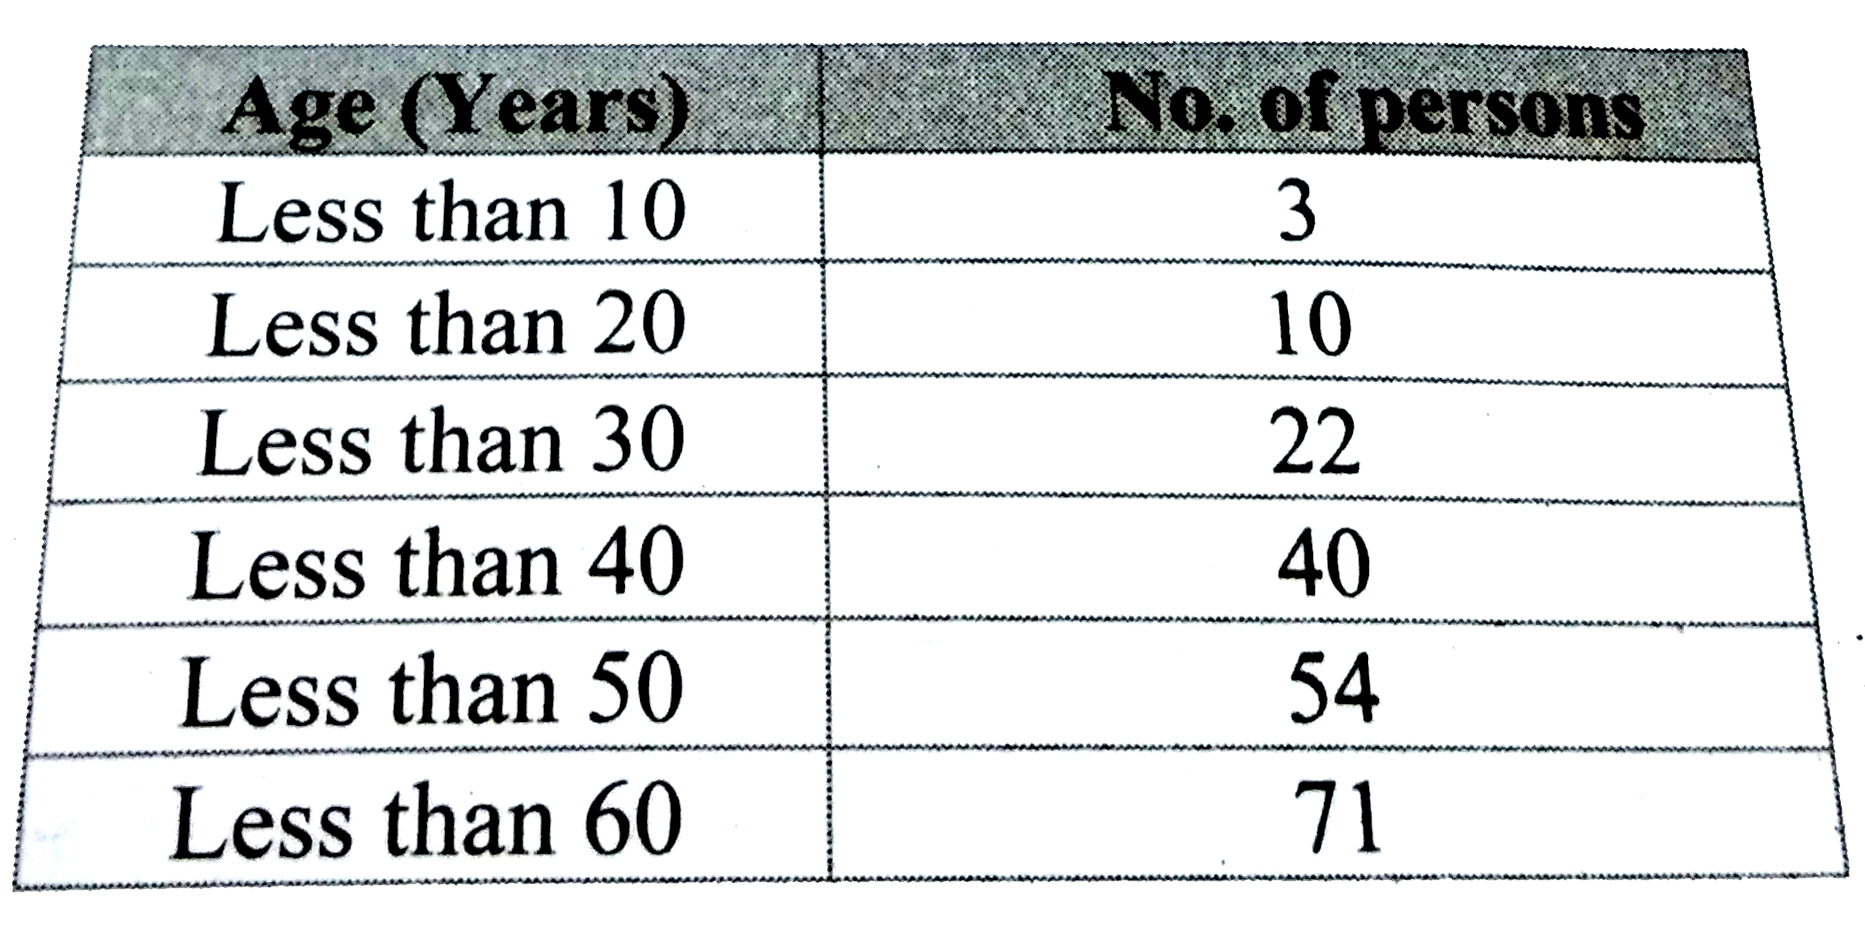
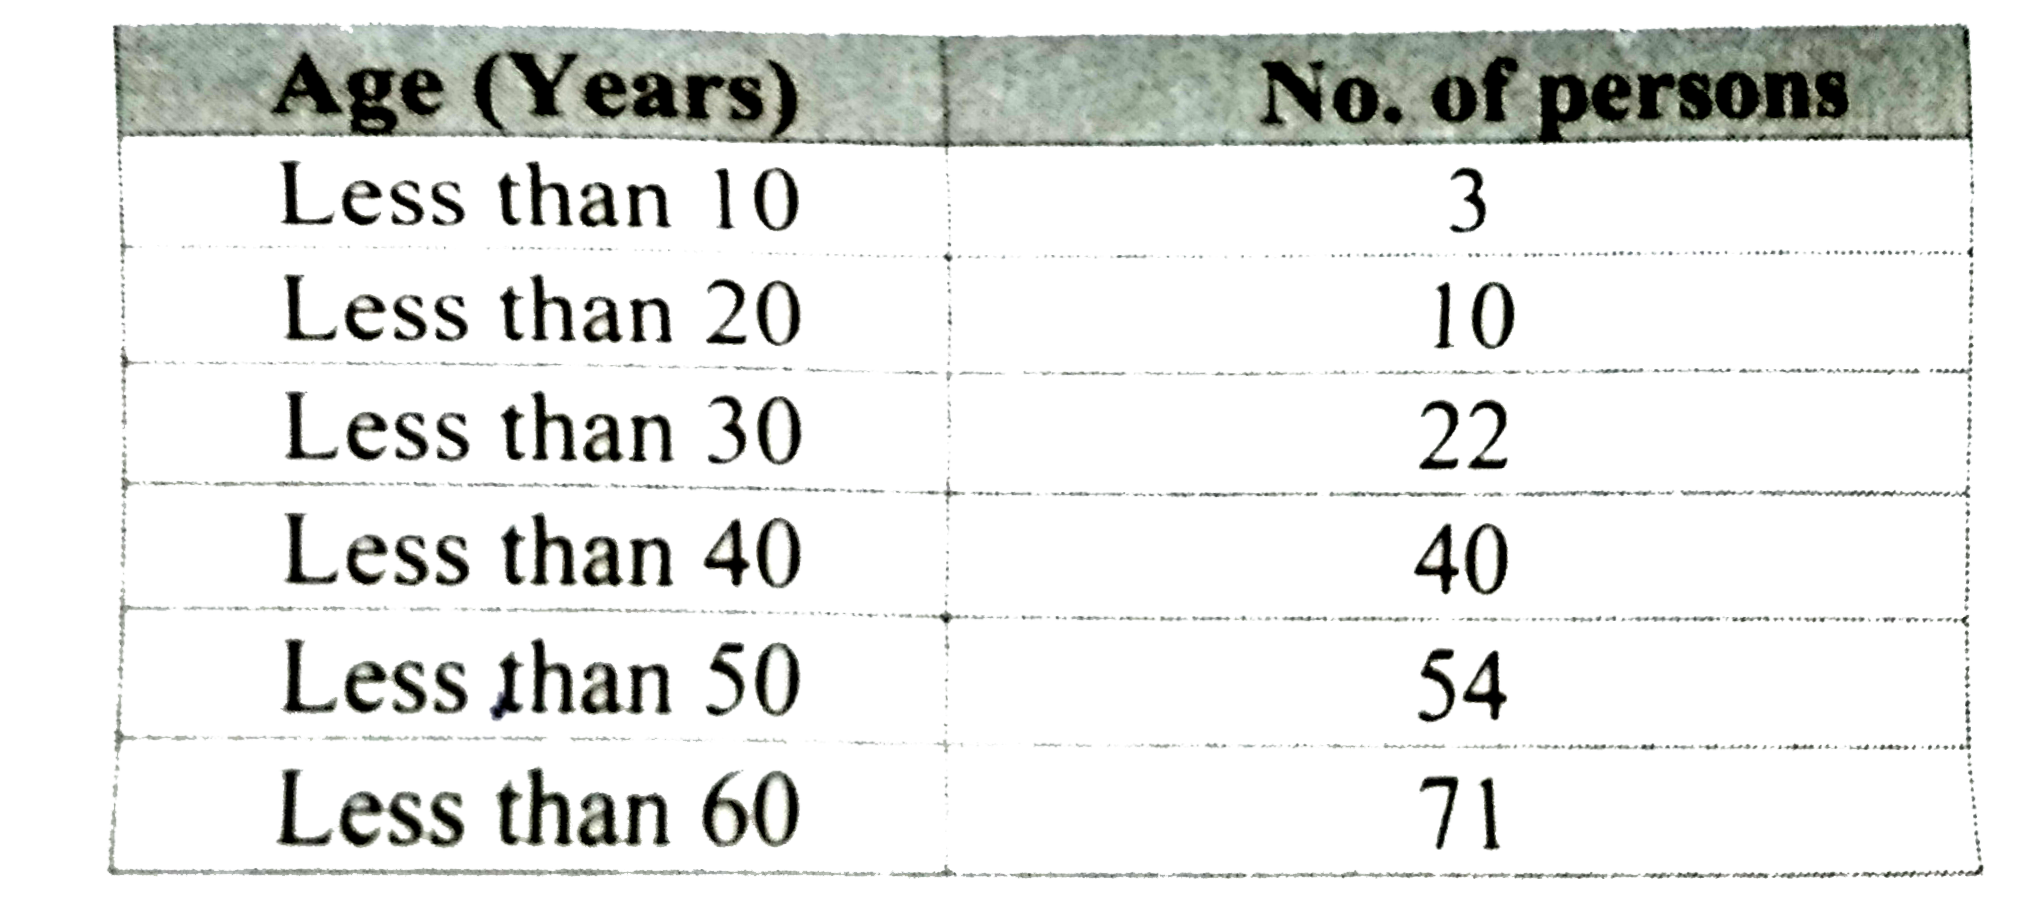
View SolutionThe following table shows the ages of persons who visited a museum on a certain day. Find the median age of the persons visitng the museum.
View Solution
