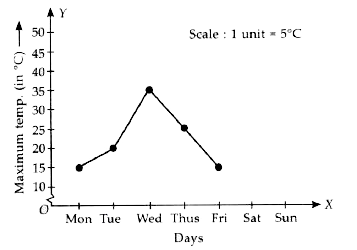
The graph given below shows the maximum temperature during the last week of April. The maximum temperature 35∘ C was on ___

Monday
Tuesday
Thursday
Wednesday
Step by step video & image solution for The graph given below shows the maximum temperature during the last week of April. The maximum temperature 35^(@) C was on ___ by Maths experts to help you in doubts & scoring excellent marks in Class 8 exams.
Updated on:21/07/2023Topper's Solved these Questions
- INTRODUCTION TO GRAPHS BOOK - MTG IIT JEE FOUNDATIONCHAPTER - INTRODUCTION TO GRAPHS EXERCISE - EXERCISE (Multiple Choice Question) (Level-2)
8 Videos
- INTRODUCTION TO GRAPHS BOOK - MTG IIT JEE FOUNDATIONCHAPTER - INTRODUCTION TO GRAPHS EXERCISE - EXERCISE (MATCH THE FOLLOWING
2 Videos
- INTRODUCTION TO GRAPHS BOOK - MTG IIT JEE FOUNDATIONCHAPTER - INTRODUCTION TO GRAPHS EXERCISE - NCERT SECTIONS (15.3)
4 Videos
- FOOTSTEPS TOWARDS JEE MAINBOOK - MTG IIT JEE FOUNDATIONCHAPTER - FOOTSTEPS TOWARDS JEE MAINEXERCISE - Section B (Numerical Value Type Questions)
9 Videos
- LINEAR EQUATIONS IN ONE VARIABLEBOOK - MTG IIT JEE FOUNDATIONCHAPTER - LINEAR EQUATIONS IN ONE VARIABLEEXERCISE - Olympiad/HOTS Corner
15 Videos
Similar Questions
Knowledge Check
The maximum temperature of thermosphere
A1473∘CB1200∘CC800∘CD1800∘CIn blast furnace, maximum temperature is in
AZone of reductionBZone of combusionCZone of fusionDZone of slag combustionAt a temperature above 35∘C
Arate of photsynthesis will decline earlier than that of respirationBrate of respiration will decline earlier than that of photosynthesisCboth decline simultaneouslyDthere is no fixed pattern
Which of the following shows the maximum rise in temperature?
View SolutionThe following graph shows the temperature forecast and the actual temperature for each day of a week.(a) On which days was the forecast temperature the same as the actual temperature? (b) What was the maximum forecast temperature during the week?(c) What was the minimum actual temperature during the week?(d) On which day did the actual temperature differ the most from the forecast temperature?
View SolutionName the flame having maximum temperature
View SolutionMaximum temperature of the day occurs generally
View SolutionAt a given temperature, the speed of sound is maximum in:
View Solution

