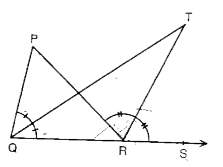
In figure, the side QRof ΔPQRis produced to a point S. If the bisectors. of ∠PQRand∠PRS meet at point T, then prove that ∠QTR=12∠QPR.
 Solution in Punjabi
Step by step video & image solution for In figure, the side QR of Delta PQR is produced to a point S. If the bisectors. of /_PQR and /_PRS meet at point T, then prove that /_QTR = 1/2 /_QPR. by Maths experts to help you in doubts & scoring excellent marks in Class 9 exams.
Updated on:21/07/2023Topper's Solved these Questions
- LINES AND ANGLESBOOK - NAND LAL PUBLICATIONCHAPTER - LINES AND ANGLESEXERCISE - EXERCISE 6.4
1 Videos
- LINES AND ANGLESBOOK - NAND LAL PUBLICATIONCHAPTER - LINES AND ANGLESEXERCISE - EXERCISE 6.5
1 Videos
- LINES AND ANGLESBOOK - NAND LAL PUBLICATIONCHAPTER - LINES AND ANGLESEXERCISE - EXERCISE 6.2
1 Videos
- HERON'S FORMULABOOK - NAND LAL PUBLICATIONCHAPTER - HERON'S FORMULAEXERCISE - Exercise 12.2
7 Videos
- NUMBER SYSTEMSBOOK - NAND LAL PUBLICATIONCHAPTER - NUMBER SYSTEMSEXERCISE - EXERCISE 1.6
11 Videos
Similar Questions
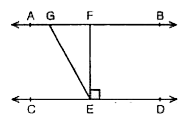
In figure, if AB∣∣CD,EFI_CDand ∠GED=126∘, find ∠AGE,∠GEFand∠FGE.

View SolutionIn figure, if PQ∣∣ST,∠PQR=110∘ and ∠RST=130∘, find ∠QRS.

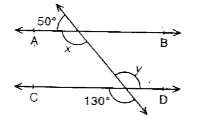
View SolutionIn figure, find the values of x and y and then show that AB || CD.

View SolutionA park, in the shape of a quadrilateral ABCD, has ∠C=90∘, AB=9m,BC=12m,CD=5m and AD=8m. How much area does it occupy ?
View SolutionFind : 6412.
View SolutionHow many lines of symmetry does the above figure have ?
View SolutionDetermine the point of symmetry of a regular hexagon.
View SolutionDtermine the images of the following figure about the given line :
View SolutionDraw the bisector of ∠AOB=58∘
ltimg src="https://d10lpgp6xz60nq.cloudfront.net/physics_images/PS_MATH_VII_C05_S01_009_Q01.png" width="80%"gt
View SolutionMatch the following Column A to Column B

View SolutionMatch the following Column A to Column B

View SolutionMatch the following Column A to Column B

View SolutionFind the area of the figure given below.

View SolutionThe area of the shaded part in the figure given below is ______.

View SolutionThe inequation represented by the graph given below is :
View SolutionThe inequation that best describes the graph given below is _________
View Solution
