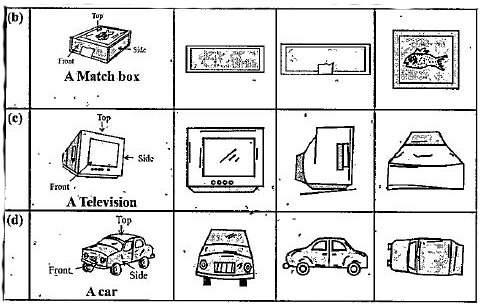
For each of the given solid, the three views are given. Identify for each solid the corresponding top, front and side views.

 Solution in Punjabi
Step by step video & image solution for For each of the given solid, the three views are given. Identify for each solid the corresponding top, front and side views. by Maths experts to help you in doubts & scoring excellent marks in Class 8 exams.
Updated on:21/07/2023Topper's Solved these Questions
- VISUALISING SOLID SHAPESBOOK - NAND LAL PUBLICATIONCHAPTER - VISUALISING SOLID SHAPESEXERCISE - EXERCISE 10.2
8 Videos
- VISUALISING SOLID SHAPESBOOK - NAND LAL PUBLICATIONCHAPTER - VISUALISING SOLID SHAPESEXERCISE - EXERCISE 10.3
16 Videos
- UNDERSTANDING QUADRILATERALS BOOK - NAND LAL PUBLICATIONCHAPTER - UNDERSTANDING QUADRILATERALS EXERCISE - SAMPLE PAPER FOR PRACTICE
21 Videos
Similar Questions
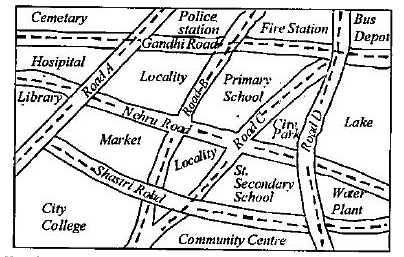
Look at the given map of a city

Answer the following :
Colour the map as follows : Blue-Water, Red-fire station, Orange-library, Yellow-School, Green-Park, Pink-College, Purple-Hospital, Brown-Cemetery.
View SolutionCan a polyhedron have for its faces: 3 triangles?
View SolutionCorrect the statements given below .
Parallel sides of the isosceles trapezium are equal .
View SolutionDetermine the point of symmetry of a regular hexagon.
View SolutionDtermine the images of the following figure about the given line :
View SolutionMatch the following Column A to Column B

View SolutionMatch the following Column A to Column B

View SolutionMatch the following Column A to Column B

View SolutionFind the area of figure given below.

View SolutionFind the perimeter of the figure given below.

View SolutionFind the area of the figure given below.

View SolutionCalculate the volume of the given solid.
ltimg src="https://d10lpgp6xz60nq.cloudfront.net/physics_images/PS_MATH_VII_C06_E03_002_Q01.png" width="80%"gt
View SolutionThe area of the shaded part in the figure given below is ______.

View SolutionThe inequation represented by the graph given below is :
View SolutionThe inequation that best describes the graph given below is _________
View SolutionThe inequation that best describes the following graph is _________
View Solution
