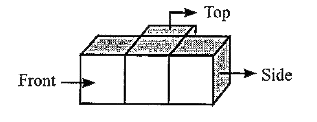
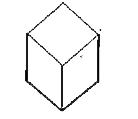
State whether true or false.
 adjoining figure represent the net of cubeSolution in Punjabi
Step by step video & image solution for State whether true or false. adjoining figure represent the net of cube by Maths experts to help you in doubts & scoring excellent marks in Class 8 exams.
Updated on:21/07/2023Topper's Solved these Questions
- VISUALISING SOLID SHAPESBOOK - NAND LAL PUBLICATIONCHAPTER - VISUALISING SOLID SHAPESEXERCISE - ADDITIONAL QUESTIONS FOR PRACTICE (Short Answer Type Questions)
4 Videos
- VISUALISING SOLID SHAPESBOOK - NAND LAL PUBLICATIONCHAPTER - VISUALISING SOLID SHAPESEXERCISE - ADDITIONAL QUESTIONS FOR PRACTICE (HOTS (High Order Thinking Skill))
1 Videos
- VISUALISING SOLID SHAPESBOOK - NAND LAL PUBLICATIONCHAPTER - VISUALISING SOLID SHAPESEXERCISE - EXERCISE 10.3
16 Videos
- UNDERSTANDING QUADRILATERALS BOOK - NAND LAL PUBLICATIONCHAPTER - UNDERSTANDING QUADRILATERALS EXERCISE - SAMPLE PAPER FOR PRACTICE
21 Videos
Similar Questions
Make the front side and top view of

View SolutionWhat change will be observed in the number of faces, edges and vertices of a cube if
One of its corner is sliced.
Two of its corner are sliced.

View SolutionCan a polyhedron have for its faces: 3 triangles?
View SolutionCorrect the statements given below .
Parallel sides of the isosceles trapezium are equal .
View SolutionHow many lines of symmetry does the above figure have ?
View SolutionDetermine the point of symmetry of a regular hexagon.
View SolutionDtermine the images of the following figure about the given line :
View SolutionMatch the following Column A to Column B

View SolutionMatch the following Column A to Column B

View SolutionMatch the following Column A to Column B

View SolutionFind the area of figure given below.

View SolutionFind the perimeter of the figure given below.

View SolutionFind the area of the figure given below.

View SolutionThe area of the shaded part in the figure given below is ______.

View SolutionThe inequation represented by the graph given below is :
View SolutionThe inequation that best describes the graph given below is _________
View Solution
