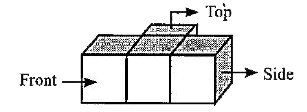
Make the front, side and top view of the figure.
 Solution in Punjabi
Step by step video & image solution for Make the front, side and top view of the figure. by Maths experts to help you in doubts & scoring excellent marks in Class 8 exams.
Topper's Solved these Questions
- BOOK - NAND LAL PUBLICATIONCHAPTER - VISUALISING SOLID SHAPESEXERCISE - DO THIS8videos
VISUALISING SOLID SHAPES
- BOOK - NAND LAL PUBLICATIONCHAPTER - VISUALISING SOLID SHAPESEXERCISE - TRY THESE1videos
VISUALISING SOLID SHAPES
- BOOK - NAND LAL PUBLICATIONCHAPTER - VISUALISING SOLID SHAPESEXERCISE - ADDITIONAL QUESTIONS FOR PRACTICE (HOTS (High Order Thinking Skill))1videos
VISUALISING SOLID SHAPES
- BOOK - NAND LAL PUBLICATIONCHAPTER - UNDERSTANDING QUADRILATERALS EXERCISE - SAMPLE PAPER FOR PRACTICE21videos
UNDERSTANDING QUADRILATERALS
Similar Questions
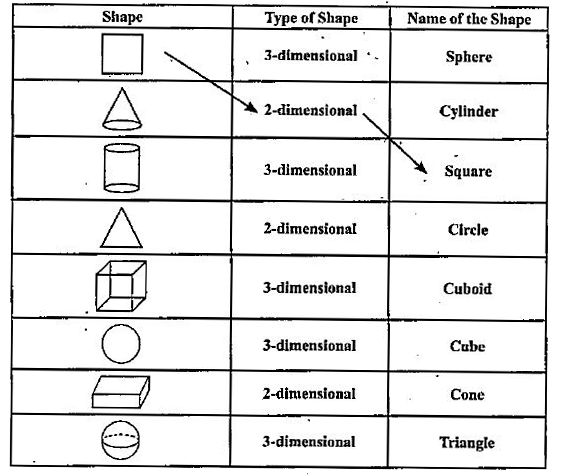
Match the following
 01:37View Solution
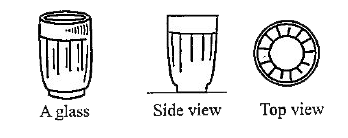
A glass can have the following views.

Why is the top view of the glass a pair of concentric circles? Will the side view appear different if taken from some other direction? Think about this.02:11View SolutionWhat change will be observed in the number of faces, edges and vertices of a cube if
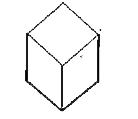
One of its corner is sliced.
Two of its corner are sliced.
 01:31View Solution
Correct the statements given below .
Parallel sides of the isosceles trapezium are equal .02:45View SolutionHow many lines of symmetry does the above figure have ?
02:17View SolutionDetermine the point of symmetry of a regular hexagon.
05:41View SolutionDtermine the images of the following figure about the given line :
02:21View SolutionMatch the following Column A to Column B
 02:03View Solution
Match the following Column A to Column B
 02:10View Solution
Match the following Column A to Column B
 02:17View Solution
Find the area of the figure given below.
 02:10View Solution
The area of the shaded part in the figure given below is ______.
 04:23View Solution
The inequation represented by the graph given below is :
01:59View SolutionThe inequation that best describes the graph given below is _________
01:19View SolutionThe inequation that best describes the following graph is _________
02:41View SolutionWhich inequations represent the shaded region in the given figure
01:52View Solution

