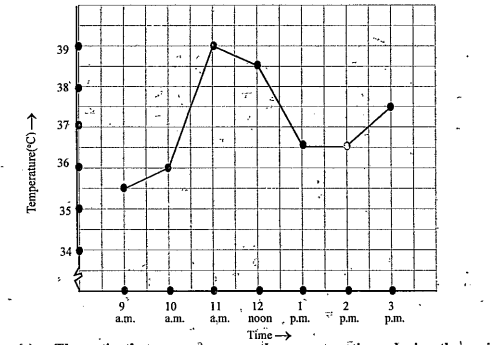
The following graph shows the temperature of a patient in a hospital,recorded every hour.
During which periods did the patient's temperature showed an upward trend?
 Solution in Punjabi
Step by step video & image solution for The following graph shows the temperature of a patient in a hospital,recorded every hour.During which periods did the patient's temperature showed an upward trend? by Maths experts to help you in doubts & scoring excellent marks in Class 8 exams.
Updated on:21/07/2023Topper's Solved these Questions
- INTRODUCTION TO GRAPHS BOOK - NAND LAL PUBLICATIONCHAPTER - INTRODUCTION TO GRAPHS EXERCISE - EXERCISE 15.2
8 Videos
- INTRODUCTION TO GRAPHS BOOK - NAND LAL PUBLICATIONCHAPTER - INTRODUCTION TO GRAPHS EXERCISE - EXERCISE 15.3
5 Videos
- EXPONENTS AND POWERBOOK - NAND LAL PUBLICATIONCHAPTER - EXPONENTS AND POWEREXERCISE - SAMPLE PAPER FOR PRACTICE
22 Videos
- LINEAR EQUATIONS IN ONE VARIABLEBOOK - NAND LAL PUBLICATIONCHAPTER - LINEAR EQUATIONS IN ONE VARIABLEEXERCISE - SAMPLE PAPER FOR PRACTICE
21 Videos
Similar Questions
Plot the following points on a graph sheet .Verify if they lie on a line.
A (4,0),B(4,2),C(4,6),D(4,2.5).
View SolutionDraw the graphs for the following tables of values , with suitable scales on the axes .
Cost of apples

View SolutionFill in the blanks.
26×2−8 can be expressed as a power of rational number with positive exponent as ________.
View SolutionIf 3x is an even number then the next even number is ___________.
View SolutionWhich of the following are correct chain isomers of butane ? (i)
View SolutionDetermine the point of symmetry of a regular hexagon.
View SolutionDtermine the images of the following figure about the given line :
View SolutionMatch the following Column A to Column B

View SolutionMatch the following Column A to Column B

View SolutionMatch the following Column A to Column B

View SolutionThe inequation represented by the graph given below is :
View SolutionThe inequation that best describes the graph given below is _________
View SolutionThe inequation that best describes the following graph is _________
View SolutionWhich inequations represent the shaded region in the given figure
View SolutionThe following graph shows the temperature of a patient in a hospital,recorded every hour: (a)What was the patients temperature at 1 p.m? (b)When was the patient's temperature 38.5^@ C? (c)The patient's temperature was the samae two times during the period given.What were these two times? (d)What was the temperature at 1.30 p.m?How did you arrive at your answer? (e)During which periods did the patients temperature showed an upward trend?
View SolutionThe following graph shows the temperature of a natient in a hospital, recorded every hour.
What was the patient's temperature at 1 p.m.?

View Solution
