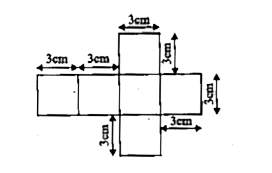
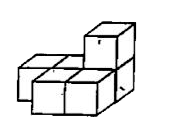
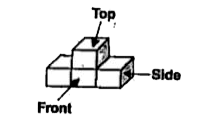
Using an isometric dot paper draw the solid shape formed by the given net.
 Solution in Punjabi
Step by step video & image solution for Using an isometric dot paper draw the solid shape formed by the given net. by Maths experts to help you in doubts & scoring excellent marks in Class 7 exams.
Updated on:21/07/2023Topper's Solved these Questions
- VISUALISING SOLID SHAPESBOOK - SWAN PUBLICATIONCHAPTER - VISUALISING SOLID SHAPESEXERCISE - Exercise 15.3
26 Videos
- VISUALISING SOLID SHAPESBOOK - SWAN PUBLICATIONCHAPTER - VISUALISING SOLID SHAPESEXERCISE - OTHER IMPORTANT QUESTIONS (I. Multiple Choioe Questions )
12 Videos
- VISUALISING SOLID SHAPESBOOK - SWAN PUBLICATIONCHAPTER - VISUALISING SOLID SHAPESEXERCISE - OTHER IMPORTANT QUESTIONS (III. Which of the following is true and which is false.)
6 Videos
- TRIANGLESBOOK - SWAN PUBLICATIONCHAPTER - TRIANGLESEXERCISE - Other Important Questions (True or false)
6 Videos
Similar Questions
Count the number of cubes in each of the following figures.

View Solutionldentlfy the top view of the solid:

View SolutionA sphere has 2 faces.
View SolutionAll the altitudes of an obtuse triangle lie inside the triangle
View SolutionDetermine the point of symmetry of a regular hexagon.
View SolutionDtermine the images of the following figure about the given line :
View SolutionDraw the bisector of ∠AOB=58∘
ltimg src="https://d10lpgp6xz60nq.cloudfront.net/physics_images/PS_MATH_VII_C05_S01_009_Q01.png" width="80%"gt
View SolutionMatch the following Column A to Column B

View SolutionMatch the following Column A to Column B

View SolutionMatch the following Column A to Column B

View SolutionFind the area of figure given below.

View SolutionFind the area of the figure given below.

View SolutionCalculate the volume of the given solid.
ltimg src="https://d10lpgp6xz60nq.cloudfront.net/physics_images/PS_MATH_VII_C06_E03_002_Q01.png" width="80%"gt
View SolutionThe area of the shaded part in the figure given below is ______.

View SolutionThe inequation represented by the graph given below is :
View SolutionThe inequation that best describes the graph given below is _________
View Solution
