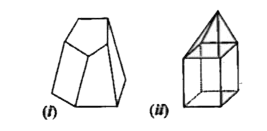
Verify Euler's formula for these solids .
 Solution in Punjabi
Step by step video & image solution for Verify Euler's formula for these solids . by Maths experts to help you in doubts & scoring excellent marks in Class 8 exams.
Updated on:21/07/2023Topper's Solved these Questions
Similar Questions
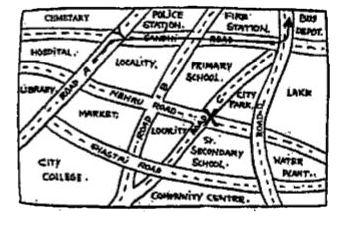
Look at the given map of city .

(a) Colour the maps as follows: Blue water , red -fire station , orange -library , yellow -schools , Green -park , Pink -college , purple -Hospital (b) Mark a green 'X' at the intersection of Road 'C' and nehru Road , Green - park ,Pink College , purple - Hospital (c ) In a red , draw a short street route from Library to the bus depot .
(d) Which is further east , the city park or the market ?
(e) Which is further south, the primary school or the Sr. Secondary School ?
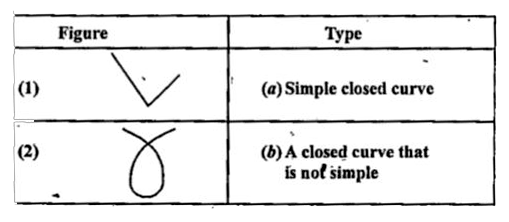
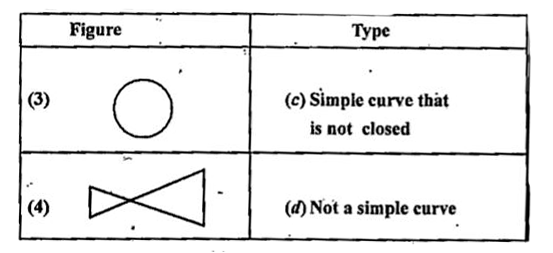
View SolutionMatch the following : (Caution! A figure may match to more than one type).


Compare your matchings with those of your friends. Do the agree?
View SolutionIdentify the cell organelle 'A' :-
ltimg src="https://d10lpgp6xz60nq.cloudfront.net/physics_images/ALN_BIO_C10_E08_018_Q01.png" width="80%"gt
View SolutionHow many lines of symmetry does the above figure have ?
View SolutionWhich of the following are correct chain isomers of butane ? (i)
View SolutionDetermine the point of symmetry of a regular hexagon.
View SolutionDtermine the images of the following figure about the given line :
View SolutionMatch the following Column A to Column B

View SolutionMatch the following Column A to Column B

View SolutionMatch the following Column A to Column B

View SolutionFind the area of the figure given below.

View SolutionCalculate the volume of the given solid.
ltimg src="https://d10lpgp6xz60nq.cloudfront.net/physics_images/PS_MATH_VII_C06_E03_002_Q01.png" width="80%"gt
View SolutionThe inequation represented by the graph given below is :
View SolutionThe inequation that best describes the graph given below is _________
View SolutionThe inequation that best describes the following graph is _________
View SolutionWhich inequations represent the shaded region in the given figure
View Solution
