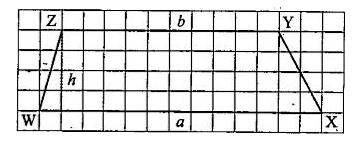
Draw any trapezium WXYZ on a piece of graph paper as shown in the fig. and cut it out.
 Solution in Punjabi
Step by step video & image solution for Draw any trapezium WXYZ on a piece of graph paper as shown in the fig. and cut it out. by Maths experts to help you in doubts & scoring excellent marks in Class 8 exams.
Updated on:21/07/2023Topper's Solved these Questions
- MENSURATIONBOOK - SWAN PUBLICATIONCHAPTER - MENSURATIONEXERCISE - Think, Discuss And Write
9 Videos
- MENSURATIONBOOK - SWAN PUBLICATIONCHAPTER - MENSURATIONEXERCISE - Exercise 11.1
4 Videos
- MENSURATIONBOOK - SWAN PUBLICATIONCHAPTER - MENSURATIONEXERCISE - Try These
23 Videos
- LINEAR EQUATIONS IN ONE VARIABLE BOOK - SWAN PUBLICATIONCHAPTER - LINEAR EQUATIONS IN ONE VARIABLE EXERCISE - EXERCISE 2.6
14 Videos
- PLAYING WITH NUMBERSBOOK - SWAN PUBLICATIONCHAPTER - PLAYING WITH NUMBERSEXERCISE - Exercise 2
4 Videos
Similar Questions
A parallelogram is divided into two congruent triangles by drawing a diagonal across it. Can we divide a trapezium into two congruent triangles?
View SolutionA square and a rectangular field with measurements as given in the figure have the same perimeter.Which field has a larger area ?

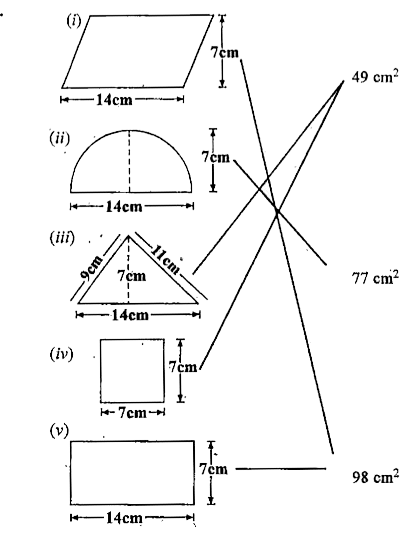
View Solution(a) Match the following figures with their respective areas in the box.

(b) Write the perimeter of each shape.
View SolutionSolve the following equations. 8x−33x=2
View SolutionIf 21y5 is a multiple of 3 ,where,y is a digit,what is the value of y.
View SolutionDetermine the point of symmetry of a regular hexagon.
View SolutionDraw the bisector of ∠AOB=58∘
ltimg src="https://d10lpgp6xz60nq.cloudfront.net/physics_images/PS_MATH_VII_C05_S01_009_Q01.png" width="80%"gt
View SolutionMatch the following Column A to Column B

View SolutionMatch the following Column A to Column B

View SolutionMatch the following Column A to Column B

View SolutionThe inequation represented by the graph given below is :
View SolutionThe inequation that best describes the graph given below is _________
View SolutionThe inequation that best describes the following graph is _________
View SolutionIn Fig, find the value of x.
ltimg src="https://d10lpgp6xz60nq.cloudfront.net/physics_images/PS_MATH_IX_C12_S01_032_Q01.png" width="80%"gt
View SolutionThe equation of straight line shown in figure is :
ltimg src="https://d10lpgp6xz60nq.cloudfront.net/physics_images/ALN_PHY_R04_E01_020_Q01.png" width="80%"gt
View SolutionWhat is the distance OA for the square shown in figure :- ltimg src="https://d10lpgp6xz60nq.cloudfront.net/physics_images/ALN_PHY_R05_E01_015_Q01.png" width="80%"gt
View Solution
