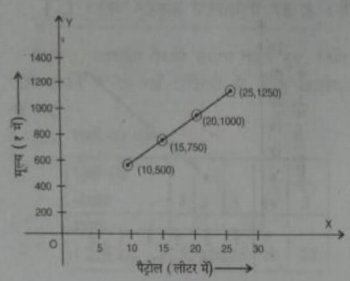
आकृति में दिए गए आलेख को देखिए ।

15.5 लीटर पैट्रोल का मूल्य ज्ञात कीजिए।
Step by step video & image solution for आकृति में दिए गए आलेख को देखिए । 15.5 लीटर पैट्रोल का मूल्य ज्ञात कीजिए। by Maths experts to help you in doubts & scoring excellent marks in Class 8 exams.
Updated on:21/07/2023Topper's Solved these Questions
- आलेखों का परिचयBOOK - MBD HINDI-HARYANA BOARDCHAPTER - आलेखों का परिचयEXERCISE - EXERCISE
12 Videos
- आँकड़ों का प्रबंधनBOOK - MBD HINDI-HARYANA BOARDCHAPTER - आँकड़ों का प्रबंधनEXERCISE - EXERCISE
50 Videos
- एक चर वाले रैखिक समीकरणBOOK - MBD HINDI-HARYANA BOARDCHAPTER - एक चर वाले रैखिक समीकरणEXERCISE - EXERCISE
142 Videos
Similar Questions
कातीर्य तल में बिंदुओं (5, 0), (0, 5), (2, 5), (5, 2), (-3, 5), (-3, -5), (5, -3) और (6, 1) का स्थान निर्धारण कीजिए ।
View Solutionनिम्नलिखित मे से किन आकंड़ों को दर्शाने के लिए आप एक आयतचित्र का प्रयोग करेंगे ?
(a) एक डाकिये के थैले में विभिन्न क्षेत्रों के पत्रों की संख्या ।
(b) किसी खेलकूद प्रतियोगिता में प्रत्याशियों की ऊँचाइया।
(c) 5 कंपनियों द्वारा निर्मित कैसेटों की संख्या ।
(d) किसी स्टेशन पर प्रातः 7 बजे से सायं 7 बजे तक रेलगाड़िओं से जाने वाले यात्रियों की संख्या ।
प्रत्येक के लिए, कारण भी दीजिये ।
View Solutionनिम्न समीकरण को हल कीजिए : x−2=7
View SolutionHow many lines of symmetry does the above figure have ?
View SolutionWhich of the following are correct chain isomers of butane ? (i)
View SolutionDetermine the point of symmetry of a regular hexagon.
View SolutionDtermine the images of the following figure about the given line :
View SolutionMatch the following Column A to Column B

View SolutionMatch the following Column A to Column B

View SolutionMatch the following Column A to Column B

View SolutionFind the area of the figure given below.

View SolutionThe area of the shaded part in the figure given below is ______.

View SolutionThe inequation represented by the graph given below is :
View SolutionThe inequation that best describes the graph given below is _________
View SolutionThe inequation that best describes the following graph is _________
View SolutionWhich inequations represent the shaded region in the given figure
View Solution
