नीचे दी गई तालिका में दी गई दो परीक्षाओं में पाँच विभिन्न विद्यालयों से अनुपस्थित विद्यार्थियों की संख्या तथा उपस्थित विद्यार्थियों के प्रतिशत को दर्शाया गया है। यह तालिका क्रमश : जीव विज्ञान तथा भौतिकी की परीक्षा में उपस्थित विद्यार्थियों के प्रतिशत को भी दर्शाती है।

विद्यालय N से भौतिकी तथा जीव विज्ञान की परीक्षा में उपस्थित विद्यार्थियों की संख्या में क्या अंतर है ?
(a) 21150 (b) 14352 (c) 22594 (d) 18075
21150
14352
22594
18075
The correct Answer is:D
Step by step video & image solution for नीचे दी गई तालिका में दी गई दो परीक्षाओं में पाँच विभिन्न विद्यालयों से अनुपस्थित विद्यार्थियों की संख्या तथा उपस्थित विद्यार्थियों के प्रतिशत को दर्शाया गया है। यह तालिका क्रमश : जीव विज्ञान तथा भौतिकी की परीक्षा में उपस्थित विद्यार्थियों के प्रतिशत को भी दर्शाती है। विद्यालय N से भौतिकी तथा जीव विज्ञान की परीक्षा में उपस्थित विद्यार्थियों की संख्या में क्या अंतर है ? (a) 21150 (b) 14352 (c) 22594 (d) 18075 by Maths experts to help you in doubts & scoring excellent marks in Class 14 exams.
Updated on:21/07/2023Similar Questions
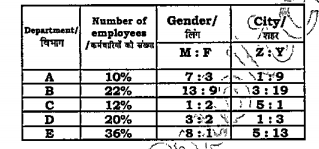
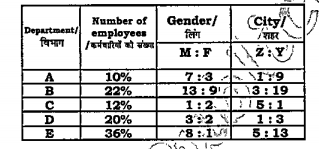
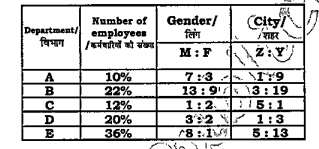
The given table shows the number (in percent) of employees working in different depratments of an organization. The table also shows the ratio of males and females and the ratio of employees living in city Z and employees , living in city Y. The total number of employees in the organization 80,000.
दी गई तालिका में एक संगठन के विभिन्न विभागों में कार्य कर रहे कर्मचारियों की संख्या ( प्रतिशत में ) को दर्शाया गया है। यह तालिका पुरूषों तथा महिलाओं के अनुपाव को तथा शहर ,Z में रह रहे कर्मचारियों तथा शहर Y में रह रहे कर्मचारियों के अनुपात को भी दर्शाती है। संगठन रद में कुल कर्मचारियों की संख्या 80000 है। How many employees of department A and C together are living in city Z?
विभाग A तथा C के कितने कर्मचारी, शहर Z में साथ-मिलकर रह रहें है?
View SolutionThe given table shows the number (in percent) of employees working in different depratments of an organization. The table also shows the ratio of males and females and the ratio of employees living in city Z and employees , living in city Y. The total number of employees in the organization 80,000.
दी गई तालिका में एक संगठन के विभिन्न विभागों में कार्य कर रहे कर्मचारियों की संख्या ( प्रतिशत में ) को दर्शाया गया है। यह तालिका पुरूषों तथा महिलाओं के अनुपाव को तथा शहर ,Z में रह रहे कर्मचारियों तथा शहर Y में रह रहे कर्मचारियों के अनुपात को भी दर्शाती है। संगठन रद में कुल कर्मचारियों की संख्या 80000 है। On an average how many residents of city Y are working in each department?
शहर Y के कितने निवासी औसतन एक विभाग में कार्य कर रहे है?
View SolutionThe given table shows the number (in percent) of employees working in different depratments of an organization. The table also shows the ratio of males and females and the ratio of employees living in city Z and employees , living in city Y. The total number of employees in the organization 80,000.
दी गई तालिका में एक संगठन के विभिन्न विभागों में कार्य कर रहे कर्मचारियों की संख्या ( प्रतिशत में ) को दर्शाया गया है। यह तालिका पुरूषों तथा महिलाओं के अनुपाव को तथा शहर ,Z में रह रहे कर्मचारियों तथा शहर Y में रह रहे कर्मचारियों के अनुपात को भी दर्शाती है। संगठन रद में कुल कर्मचारियों की संख्या 80000 है। what are the total number of employee in department A and E together?
विभाग A तथा E में मिलाकर कुल कर्मचारियों की संख्या क्या है?
View Solutionविद्यार्थियों की एक पंक्ति में , सोहन का स्थान दोनों मे से किसी भी किनारे से 9 वाँ है तब विद्यार्थियों की कुल संख्या होगी ?
View SolutionThe Table shows the Number of Laptops and Desktops manufactured by a company. यह तालिका किसी कंपनी के द्वारा निर्मित लैपटॉप एवं डेस्कटॉप की संख्या को दर्शाती है | What was the difference in the total number of Laptops and Desktops manufactured in 2009 to the total number of Laptops and Desktops manufactured in 2011? 2009 में निर्मित लैपटॉप तथा डेस्कटॉप की कुल संख्या तथा 2011 में निर्मित लैपटॉप और डेस्कटॉप की कुल संख्या में क्या अंतर है ?
View Solutionप्राथमिक स्तर पर पढ़ने की क्षमता के आकलन में सबसे कम महत्वपूर्ण है
View SolutionThe given Bar Graph presents the number of students of two schools for six years. दिया गया दंड आरेख (बार ग्राफ) छह वर्षो के दौरान दो स्कूलों में विद्यार्थियों की संख्या को दर्शाता है| In which year, the percentage increase in students in school B is the highest in comparison to its previous year? किस वर्ष में, स्कूल B के विद्यार्थियों की संख्या में प्रतिशत वृद्धि इसके पिछले वर्ष की तुलना में सबसे अधिक है?
View SolutionThe given Bar Graph presents the number of students of two schools for six years. दिया गया दंड आरेख (बार ग्राफ) छह वर्षो के दौरान दो स्कूलों में विद्यार्थियों की संख्या को दर्शाता है| In which year, percentage increase of students in school A is the highest in comparison to its previous year ? किस वर्ष में, स्कूल A की विद्याथियों की संख्या में प्रतिशत वृद्धि इसके पिछले वर्ष की तुलना में सबसे अधिक है?
View Solution
