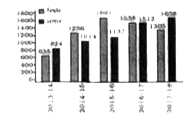
दिया गया दंड आरेख (बार ग्राफ ) पाँच वित्त वर्षों, 2013−2014 से 2017−2018 के दौरान किसी कंपनी द्वारा निर्मित किसी वस्तु (टन में ) के आयात और निर्यात को दर्शाता है।

किस वित्त में पिछले वित्त वर्ष की तुलना में आयात में प्रतिशत वृद्धि सर्वाधिक है ?
2014−2015
2016−2017
2017−2018
2015−2016
The correct Answer is:B
Step by step video, text & image solution for दिया गया दंड आरेख (बार ग्राफ ) पाँच वित्त वर्षों, 2013-2014 से 2017-2018 के दौरान किसी कंपनी द्वारा निर्मित किसी वस्तु (टन में ) के आयात और निर्यात को दर्शाता है। किस वित्त में पिछले वित्त वर्ष की तुलना में आयात में प्रतिशत वृद्धि सर्वाधिक है ? by Maths experts to help you in doubts & scoring excellent marks in Class 14 exams.
Similar Questions
The given Bar Graph presents the Revenue of Expenditure (in crores of rupees) of a company during the five year period, 2014 - 2018. दिया गया दंड आरेख (Bar graph) 5 वर्ष की अवधि 2014-2018 के दौरान किसी कंपनी के राजस्व और व्यय (करोड़ रुपए में) को दर्शाता है| किस वर्ष में राजस्व में प्रति प्रतिशत वृद्धि इसके पिछले वर्ष की तुलना में 5% और 8% के बीच है? In which year the percentage increase in revenue as compared to that in its preceding year is between 5% and 8% ?
04:58View SolutionThe given bar graph presents the results in terms of number of students in a school for the 5 academic years, 2013-2014 to 2017-2018. दिया गया दंड आरेख ( बार ग्राफ) 5 शैक्षणिक वर्षो, 2013-2014 से 2017-2018, के दौरान किसी स्कूल के परीक्षाफल को विद्यार्थियों की संख्या के रूप में दर्शाता है| what is the average of failed students in five academic years? 5 शैक्षणिक वर्षों में अनुत्तीर्ण हुए विद्यार्थियों का औसत क्या है?
01:12View SolutionThe given Bar Graph presents the Imports and Exports of an items (in tonnes) manufactured by a company for the five financial Years, 2013-2014 to 2017-2018. दिया गया दंड आरेख (बार ग्राफ) 5 वित्त वर्षों, 2013-2014 से 2011-2018, के दौरान किसी कंपनी द्वारा निर्मित किसी वस्तु के आयात और निर्यात (टन में) को दर्शाता है| What is the average of Import (in tonnes) during the five financial Years? 5 वित्तीय वर्ष के दौरान आयात का औसत (टन में) क्या है?
02:14View SolutionThe given Bar Graph presents the Imports and Exports of an items (in tonnes) manufactured by a company for the five financial Years, 2013-2014 to 2017-2018. दिया गया दंड आरेख (बार ग्राफ) 5 वित्त वर्षों, 2013-2014 से 2011-2018, के दौरान किसी कंपनी द्वारा निर्मित किसी वस्तु के आयात और निर्यात (टन में) को दर्शाता है| What is the ratio of total Exports to total Imports during the five financial Years? 5 वित्त वर्षों के दौरान कुल निर्यात और कुल आयात का अनुपात क्या है?
03:10View SolutionThe given Bar Graph presents the Imports and Exports of an item (in tonnes) manufactured by a company for the five financial years, 2013-2014 to 2017-2018. दिया गया दंड आरेख (बार ग्राफ) 5 वित्त वर्षों, 2013-2014 से 2011-2018 के दौरान एक कंपनी द्वारा निर्मित किसी वस्तु (टन में) के आयात और निर्यात को दर्शाता है | What is the ratio of total Imports to total Exports during the five financial years? पांचों वित्त वर्षों के दौरान कुल आयात और कुल निर्यात का अनुपात क्या है?
02:13View SolutionThe given Bar Graph presents the Imports and Exports of an item (in tonnes) manufactured by a company for the five financial years, 2013-2014 to 2017-2018. दिया गया दंड आरेख (बार ग्राफ) 5 वित्त वर्षों, 2013-2014 से 2011-2018 के दौरान एक कंपनी द्वारा निर्मित किसी वस्तु (टन में) के आयात और निर्यात को दर्शाता है | In which financial year, total of Exports and Imports is the highest? किस वित्त वर्ष में नियात और आयात का योगफल सर्वाधिक है?
01:40View SolutionThe given Bar Graph presents the Imports and Exports of an item (in tonnes) manufactured by a company for the five financial years, 2013-2014 to 2017-2018. दिया गया दंड आरेख (बार ग्राफ) 5 वित्त वर्षों, 2013-2014 से 2011-2018 के दौरान एक कंपनी द्वारा निर्मित किसी वस्तु (टन में) के आयात और निर्यात को दर्शाता है | What is the average of Export (in tonnes) during the five financial years? 5 वित्त वर्षों के दौरान निर्यात (टन में] का औसत कितना है?
01:47View SolutionThe given Bar Graph present the Imports and Exports of an item (in tonnes) manufactured by a company for the five financial years, 2013-2014 to 2017-2018. दिया गया दंड आरेख (बार ग्राफ) पांच वित्त वर्षों, 2013-2014 से 2017-2018, के दौरान किसी कंपनी दवारा निर्यात किसी वस्तु (टन में] के आयात और निर्यात को दर्शाता है| What is the ratio of total Imports to total Exports during 2013-2014, 2015-2016 and 2017-2018? 2013-2014, 2015-2016 3X 2017-2018 के दौरान कुल आयात का कुल निर्यात से क्या अनुपात है?
01:24View Solution

