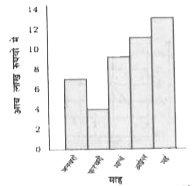
यहाँ दिया गया बार ग्राफ एक कम्पनी की आय को दर्शाता है। बार-ग्राफ का अध्ययन कीजिए और प्रश्न के उत्तर दीजिए।

किस माह में आय का पूर्व माह की आय से अनुपात अधिकतम है?
फरवरी
मार्च
अप्रैल
मई
The correct Answer is:B
Step by step video, text & image solution for यहाँ दिया गया बार ग्राफ एक कम्पनी की आय को दर्शाता है। बार-ग्राफ का अध्ययन कीजिए और प्रश्न के उत्तर दीजिए। किस माह में आय का पूर्व माह की आय से अनुपात अधिकतम है? by Maths experts to help you in doubts & scoring excellent marks in Class 14 exams.
Similar Questions
The income of A is 60% less than that of B, and the expenditure of A is equal to 60% of B’s expenditure. If A’s income is equal to 70% of B’s expenditure, then what is the ratio of the saving of A and B?
A की आय B की आय से 60% कम है, तथा A का व्यय B के व्यय के 60% के बराबर है | यदि A की आय B के व्यय के 70% के बराबर है, तो A और B की बचत का अनुपात क्या है ?03:46View SolutionThe income of Renu is 10% less than the income of Sudha, and the income of Sudha is 10% more than Rs.3000. The income of Renu is:
रेणु की आय सुधा की आय से 10% कम है और सुधा की आय 3000 रुपये से 10% अधिक है। रेणु की आय है:02:52View SolutionIn the given bar graph, the Blue bar shows the income and the Red bar shows the expenditure of a company. Study the graph and answer the question that follows
दिए गए दंड आरेख में, नीला दंड एक कंपनी की आय दिखाता है और लाल दंड खर्च (लाख रुपये में) को दर्शाता है। आरेख का अध्ययन करें और उस प्रश्न का उत्तर दें जो नीचे पूछा गया है। The percentage decrease in the income of the company in 2002 as compared to that in 2001 is:
2001 की तुलना में 2002 में कंपनी की आय में कितने प्रतिशत में कमी आई है:01:21View SolutionThe ratio of the incomes of A and B is 2:3 and that of their expenditures is 1:2. If 90% of B’s expenditure is equal to the income of A, then what is the ratio of the savings of A and B? A और B की आय का अनुपात 2: 3 है और उनके व्यय का अनुपात 1: 2 है यदि B के व्यय का 90% A की आय के बराबर है तो A और B की बचत का अनुपात कितना है?
04:06View SolutionThe given Bar Graph presents Income and Expenditure (in crores of Rupees) of a company for five years, 2014 to 2018. In which year is the Expenditure more than 40% as compared to the Expenditure in the previous year? दिया गया दंड आरेख (बार ग्राफ) 5 वर्षो, 2014 से 2018 के दौरान किसी कंपनी की आय और व्यय (करोड़ रुपए में) को दर्शाता है| पिछले वर्ष के व्यय की तुलना में किस वर्ष में वह 40% अधिक है?
04:39View SolutionThe given Bar Graph presents Income and Expenditure (in crores of Rupees) of a company for five years, 2014 to 2018. What is the ratio of total Expenditure to total Income of the company in 2014,2016 and 2017? दिया गया दंड आरेख (बार ग्राफ) 5 वर्षों, 2014 से 2018 के दौरान किसी कंपनी की आय और व्यय (करोड़ रुपए में) को दर्शाता है| 2014, 2016 और 2017 में कंपनी के कुल व्यय और कुल आय का अनुपात क्या है?
01:43View SolutionStudy the following graph which shows income and expenditure of a company over the years and answer the questions. The percentage increase in income of the company from 2007 to 2008 is. निम्नलिखित चार्ट का अध्ययन कीजिए जिसमें कंपनी की कुछ वर्षों की आय एवं उसके व्यय को दर्शाया गया है और प्रश्नों के उत्तर दीजिए : वर्ष 2007 से 2008 तक कंपनी की आय में वृद्धि का प्रतिशत कितना रहा?
01:37View SolutionStudy the following graph which shows income and expenditure of a company over the years and answer the questions. Ratio of total income to total expenditure of the company over the years is. निम्नलिखित चार्ट का अध्ययन कीजिए जिसमें कंपनी की कुछ वर्षों की आय एवं उसके व्यय को दर्शाया गया है और प्रश्नों के उत्तर दीजिए : दिए गए वर्षों में कंपनी की कुल आय और कुल व्यय का अनुपात क्या रहा?
02:16View Solution

