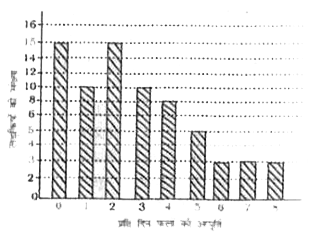
निम्नलिखित ग्राफ में 72 सत्रह - वर्षीय लड़कियों के सैम्पल में फलों की खपत (उपभोग ) के वितरण को दर्शाया गया है।

प्रतिदिन छह या अधिक आपूर्ति किए गए फलों को खाने वाली इन लड़कियों का प्रतिशत क्या था ?
12.5%
13%
10%
11%
The correct Answer is:A
Step by step video & image solution for निम्नलिखित ग्राफ में 72 सत्रह - वर्षीय लड़कियों के सैम्पल में फलों की खपत (उपभोग ) के वितरण को दर्शाया गया है। प्रतिदिन छह या अधिक आपूर्ति किए गए फलों को खाने वाली इन लड़कियों का प्रतिशत क्या था ? by Maths experts to help you in doubts & scoring excellent marks in Class 14 exams.
Updated on:21/07/2023Similar Questions
The area of the shaded part in the figure given below is ______.

View SolutionThe inequation represented by the graph given below is :
View SolutionThe inequation that best describes the graph given below is _________
View SolutionThe inequation that best describes the following graph is _________
View SolutionWhich inequations represent the shaded region in the given figure
View SolutionMatch the followings (column I with column II)
ltimg src="https://d10lpgp6xz60nq.cloudfront.net/physics_images/NCERT_BIO_XI_C03_E01_011_Q01.png" width="80%"gt
View Solution'A' is the portion of adenophypophysis which secrets different hormones 'A' is____
View SolutionIdentify A,B,C and D,E
View Solution
