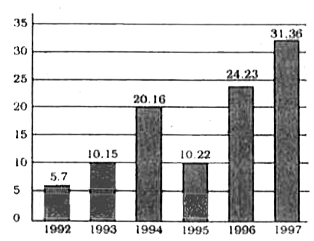
बार ग्राफ में समस्त विश्व से भारत में विदेशी प्रत्यक्ष निवेश (एफ डी आई ) की प्रवृत्ति को दर्शाया गया है।

1997 में निवेश एवं औसत निवेश के मध्य क्या अनुपात है ?
2:1
1:2
1:1
3:1
The correct Answer is:A
Step by step video & image solution for बार ग्राफ में समस्त विश्व से भारत में विदेशी प्रत्यक्ष निवेश (एफ डी आई ) की प्रवृत्ति को दर्शाया गया है। 1997 में निवेश एवं औसत निवेश के मध्य क्या अनुपात है ? by Maths experts to help you in doubts & scoring excellent marks in Class 14 exams.
Updated on:21/07/2023Similar Questions
The inequation that best describes the graph given below is _________
View SolutionThe inequation that best describes the following graph is _________
View SolutionWhich inequations represent the shaded region in the given figure
View SolutionA and B invest in the ratio 3:5. After 6 months, C joins the business, investing an amount equal to B's. At the end of the year what will be the ratio of their profits? A और B 3:5 के अनुपात में निवेश करते है। 6 महीने के बाद, C व्यवसाय में शामिल हो जाता है तथा B के बराबर राशि का निवेश करता है। वर्ष के अंत में उनके लाभ का अनुपात क्या होगा?
View SolutionThe ratio of investment by A to that by B is a business is 14:15 and the ratio of their respective profits at the end of a year is 2:5. If A invested the money for 3 months, then for how much time (in months) B invested his money?
एक व्यवसाय में A और B के द्वारा किये गए निवेश का अनुपात 14:15 है तथा वर्ष के अंत में उनके लाभों का अनुपात 2 : 5 है | यदि A ने 3 माह के लिए राशि निवेश की थी, तो B द्वारा निवेश की गयी राशि की अवधि (महीने में ) कितनी थी ?
View Solution'A' is the portion of adenophypophysis which secrets different hormones 'A' is____
View SolutionIdentify A,B,C and D,E
View SolutionConsider the following reactions.
View Solution
