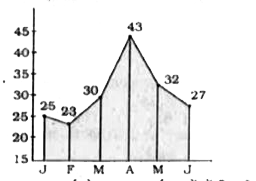
दिए गए रैखिक आलेख में एक शहर के वर्ष 1999 के पहले छह महीनों की दुर्घटनाओं का दर्शाया गया है

तदनुसार, मई से जून तक दुर्घटनाओं में कितनी प्रतिशत कमी आई है?
1538%
1518%
1558%
1578%
The correct Answer is:C
Step by step video & image solution for दिए गए रैखिक आलेख में एक शहर के वर्ष 1999 के पहले छह महीनों की दुर्घटनाओं का दर्शाया गया है तदनुसार, मई से जून तक दुर्घटनाओं में कितनी प्रतिशत कमी आई है? by Maths experts to help you in doubts & scoring excellent marks in Class 14 exams.
Updated on:21/07/2023Similar Questions
The area of the shaded part in the figure given below is ______.

View SolutionThe inequation represented by the graph given below is :
View SolutionThe inequation that best describes the graph given below is _________
View SolutionThe inequation that best describes the following graph is _________
View SolutionWhich inequations represent the shaded region in the given figure
View SolutionMatch the followings (column I with column II)
ltimg src="https://d10lpgp6xz60nq.cloudfront.net/physics_images/NCERT_BIO_XI_C03_E01_011_Q01.png" width="80%"gt
View SolutionMatch column I with column II:
ltimg src="https://d10lpgp6xz60nq.cloudfront.net/physics_images/NCERT_BIO_XI_C18_E01_003_Q01.png" width="80%"gt
View Solution'A' is the portion of adenophypophysis which secrets different hormones 'A' is____
View Solution
