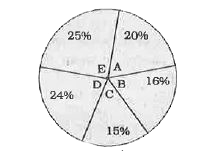
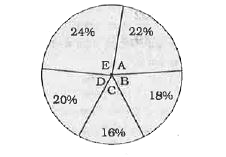
निम्न पाई चार्टो का सावधानीपूर्वक अध्ययन कीजिए

फरवरी 2014 के दौरान पाँच भिन्न बेकरीज द्वारा बेचे गए केकों ( (banana) एवं वॉलनट (walnut) दोनों ) का प्रतिशत केकों की कुल = 8000 संख्या

भिन्न बेकरीज के द्वारा उसी माह के दौरान बेचे गए (banana) केकों का प्रतिशत (banana) केकों की कुल संख्या = 5000
यदि अगस्त 2014 में फरवरी 2014 की अपेक्षा बेकरी A ने 30% अधिक केक बेचा तथा बेकरी A ने कुल 2200 केक ( एवं वॉलनट दोनों ) बेचा तो बेकरी A द्वारा अगस्त, 2014 में बेचे गए वॉलनट केकों की संख्या में फरवरी 2014 से कितने प्रतिशत की वृद्धि हुई ?
50%
54%
60%
45%
The correct Answer is:B
Similar Questions
The area of the shaded part in the figure given below is ______.

View SolutionThe inequation represented by the graph given below is :
View SolutionThe inequation that best describes the graph given below is _________
View SolutionThe inequation that best describes the following graph is _________
View SolutionWhich inequations represent the shaded region in the given figure
View SolutionIn Fig, find the value of x.
ltimg src="https://d10lpgp6xz60nq.cloudfront.net/physics_images/PS_MATH_IX_C12_S01_032_Q01.png" width="80%"gt
View SolutionMatch the followings (column I with column II)
ltimg src="https://d10lpgp6xz60nq.cloudfront.net/physics_images/NCERT_BIO_XI_C03_E01_011_Q01.png" width="80%"gt
View SolutionMatch column I with column II:
ltimg src="https://d10lpgp6xz60nq.cloudfront.net/physics_images/NCERT_BIO_XI_C18_E01_003_Q01.png" width="80%"gt
View Solution
