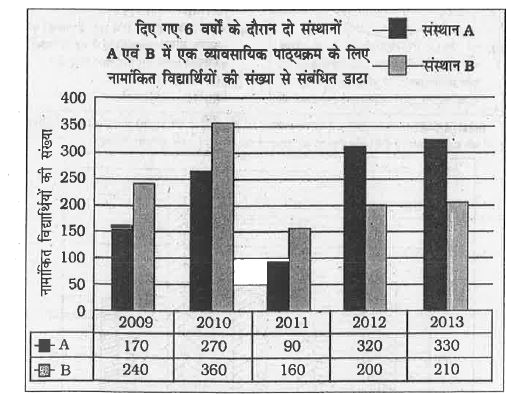
निम्न ग्राफ का ध्यानपूर्वक अध्ययन कीजिए

वर्ष 2009 एवं 2010 में संस्थान A में नामांकित विद्यार्थियों की औसत संख्या तथा वर्ष 2011 एवं 2012 में संस्थान B में नामांकित विद्यार्थियों की औसत संख्या के मध्य क्या अंतर है ?
20
40
30
10
The correct Answer is:B
Step by step video & image solution for निम्न ग्राफ का ध्यानपूर्वक अध्ययन कीजिए वर्ष 2009 एवं 2010 में संस्थान A में नामांकित विद्यार्थियों की औसत संख्या तथा वर्ष 2011 एवं 2012 में संस्थान B में नामांकित विद्यार्थियों की औसत संख्या के मध्य क्या अंतर है ? by Maths experts to help you in doubts & scoring excellent marks in Class 14 exams.
Updated on:21/07/2023Similar Questions
The given Bar Graph presents the number of students of two schools for six years. दिया गया दंड आरेख छः वर्ष की अवधि में दो विद्यालयों में छात्रों की संख्या को दर्शाता है | In which year, the percentage increase in students in school B is the highest in comparison to its previous year? किस वर्ष में, विद्यालय B में छात्रों की संख्या में प्रतिशत वृद्धि इसके पिछले वर्ष की तुलना में सबसे अधिक रही है?
View SolutionIn the given bar graph, the percentage decrease in the number of students in Institute A in 2016 is what percent of students in 2015. इस दंड आरेख में संस्थान A में 2016 में छात्रों की संख्या में प्रतिशत कमी 2015 के छात्रों की संख्या का क्या प्रतिशत है ?
View SolutionThe Table shows the Number of Laptops and Desktops manufactured by a company. यह तालिका किसी कंपनी के द्वारा निर्मित लैपटॉप एवं डेस्कटॉप की संख्या को दर्शाती है | What was the difference in the total number of Laptops and Desktops manufactured in 2009 to the total number of Laptops and Desktops manufactured in 2011? 2009 में निर्मित लैपटॉप तथा डेस्कटॉप की कुल संख्या तथा 2011 में निर्मित लैपटॉप और डेस्कटॉप की कुल संख्या में क्या अंतर है ?
View SolutionIn a particular year, the number of students enrolled in different streams in a college is as follows:
एक विशेष वर्ष में, किसी कॉलेज के विभिन्न विषयों में नामांकित छात्रों की संख्या इस प्रकार है : The percentage of girl students is:
छात्राओं का प्रतिशत है :
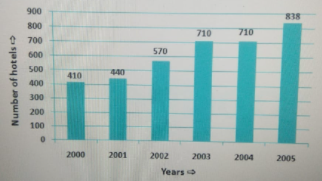
View SolutionStudy the chart and answer the questions:
In which of the given years is the percentage increase in the number of hotels in comparison to the previous year, is the maximum?
चार्ट का अध्ययन करें और प्रश्नों का उत्तर दें:पिछले वर्ष की तुलना में होटलों की संख्या में किस वर्ष में अधिकतम प्रतिशत वृद्धि हुई है?
View SolutionThe given Bar Graph presents the number of students enrolled for vocational course institutes A and B during a period of 5 years. In which year the number of students enrolled in B is x% more, where 25 lt x lt 30 , then the number of students enrolled in A in the same year? दिया गया दंड आरेख (बार ग्राफ) 5 वर्ष की अवधि के दौरान संस्थान A और B में व्यावसायिक पाठ्यक्रम के लिए नामांकित विद्यार्थियों की संख्या को दर्शाता है| किस वर्ष में संस्थान B में नामांकित विद्यार्थियों की संख्या उसी वर्ष संस्थान A में नामांकित विद्यार्थियों की संख्या से x % अधिक है, जहां 25 lt x lt 30 है?
View SolutionThe given Bar Graph presents the number of students of two schools for six years. दिया गया दंड आरेख (बार ग्राफ) छह वर्षो के दौरान दो स्कूलों में विद्यार्थियों की संख्या को दर्शाता है| In which year, the percentage increase in students in school B is the highest in comparison to its previous year? किस वर्ष में, स्कूल B के विद्यार्थियों की संख्या में प्रतिशत वृद्धि इसके पिछले वर्ष की तुलना में सबसे अधिक है?
View SolutionThe given Bar Graph presents the number of students of two schools for six years. दिया गया दंड आरेख (बार ग्राफ) छह वर्षो के दौरान दो स्कूलों में विद्यार्थियों की संख्या को दर्शाता है| In which year, the absolute difference of the students in two schools is the lowest? किस वर्ष में, दोनो स्कूलों के विद्यार्थियों की संख्या का निरपेक्ष अंतर सबसे कम है?
View Solution
