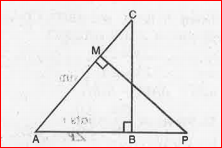
In Fig., ABC and AMP are two right triangles, right angled at B and M respectively. Prove that :- △ABC~△AMP .
 .Solution in Punjabi
Step by step video & image solution for In Fig., ABC and AMP are two right triangles, right angled at B and M respectively. Prove that :- triangleABC~ triangleAMP . . by Maths experts to help you in doubts & scoring excellent marks in Class 10 exams.
Updated on:21/07/2023Topper's Solved these Questions
- TRIANGLES BOOK - NAND LAL PUBLICATIONCHAPTER - TRIANGLES EXERCISE - EXERCISE 6.4
7 Videos
- TRIANGLES BOOK - NAND LAL PUBLICATIONCHAPTER - TRIANGLES EXERCISE - EXERCISE 6.5
14 Videos
- TRIANGLES BOOK - NAND LAL PUBLICATIONCHAPTER - TRIANGLES EXERCISE - EXERCISE 6.2
9 Videos
- SURFACE AREAS AND VOLUME BOOK - NAND LAL PUBLICATIONCHAPTER - SURFACE AREAS AND VOLUME EXERCISE - EXERCISE 13.5
7 Videos
Similar Questions
Let ΔABC~ΔDEF and their areas be, respectively, 64 cm2 and 121 cm2. If EF = 15.4 cm, find BC.
View SolutionSides of triangles are given below. Determine which of them are right triangles. In case of a right triangle, write the length of its hypotenuse. :- 7 cm, 24 cm, 25 cm
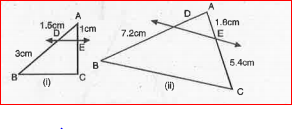
View SolutionIn fig. (i) and (ii), DE || BC. Find EC in (i) and AD in (ii).
 .
.
View SolutionA copper wire 3 mm in diameter is wound about a cylinder whose length is 12 cm, and diameter 10 cm,so as to cover the curved surface of the cylinder. Find the length and mass of the wire, assuming the density of copper to 8.88 g per cm3.
View SolutionWhich of the following are correct chain isomers of butane ? (i)
View SolutionDetermine the point of symmetry of a regular hexagon.
View SolutionDtermine the images of the following figure about the given line :
View SolutionMatch the following Column A to Column B

View SolutionMatch the following Column A to Column B

View SolutionMatch the following Column A to Column B

View SolutionThe inequation represented by the graph given below is :
View SolutionThe inequation that best describes the graph given below is _________
View SolutionThe inequation that best describes the following graph is _________
View SolutionWhich inequations represent the shaded region in the given figure
View SolutionIn Fig, find the value of x.
ltimg src="https://d10lpgp6xz60nq.cloudfront.net/physics_images/PS_MATH_IX_C12_S01_032_Q01.png" width="80%"gt
View SolutionIn the chemical reactions,
ltimg src="https://d10lpgp6xz60nq.cloudfront.net/physics_images/JM_10_CHE_P1_E01_009_S01.png" width="80%"gt
the compounds 'A' and 'B' respectively are
View Solution
