Direction :- The line graph shows annual profits (in Rs. lakh) of a certain company from 2011 to 2016. Study the graph and answer the following questions.
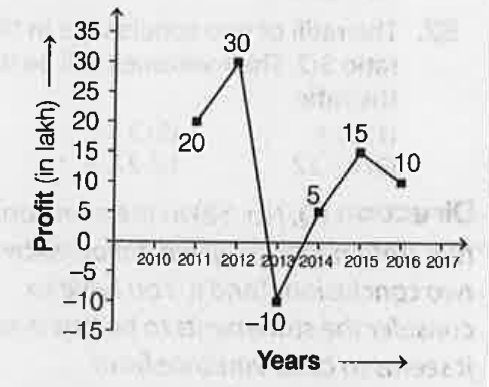
What is cumulative profits (in Rs.lakh) earned by the company in the given 6yrs?
80
70
90
100
Step by step video & image solution for Direction :- The line graph shows annual profits (in Rs. lakh) of a certain company from 2011 to 2016. Study the graph and answer the following questions. What is cumulative profits (in Rs.lakh) earned by the company in the given 6yrs? by Maths experts to help you in doubts & scoring excellent marks in Class 14 exams.
Similar Questions
Direction :- The line graph shows annual profits (in Rs. lakh) of a certain company from 2011 to 2016. Study the graph and answer the following questions.
 The company reported a loss in which year?View Solution
The line graph shows the exports by a certain company. Study the diagram and answer the following questions.
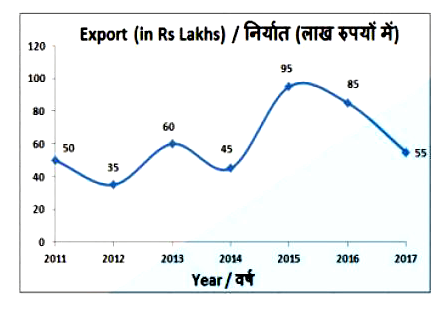
What were the total exports (in Rs lakhs) by the company in the last four years?View Solution
Knowledge Check
- Question 1 - Select One
The pie chart shows the breakup of expendoture of a manufacturing company for the year 2017. Study the diagram and answer the following questions.
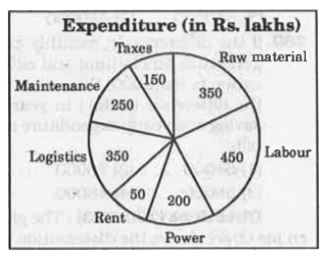
What is the total expenditure (in Rs. lakhs)?A900B1800C2000D1000 - Question 2 - Select One
The pie chart shows the breakup of expendoture of a software company for the year 2017. Study the diagram and answer the following questions.
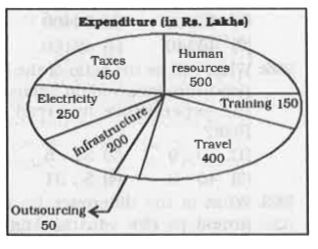
What is the total expenditure (in Rs. lakhs)?A2000B1800C2250D2100 - Question 3 - Select One
The pie chart shows the breakup of expenditure of a manufacturing company for the year 2017. Study the diagram and answer the following questions.
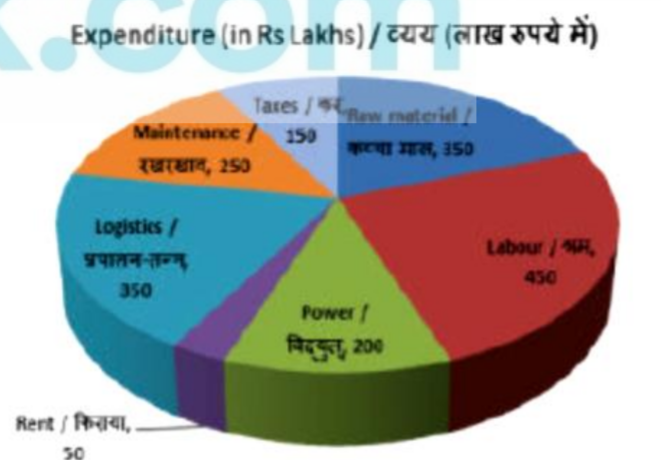
What is the total expenditure (in Rs lakhs)?A900B1800C2000D1000
The line graph shows the exprots by a certain company. Study the diagram and answer the following questions.
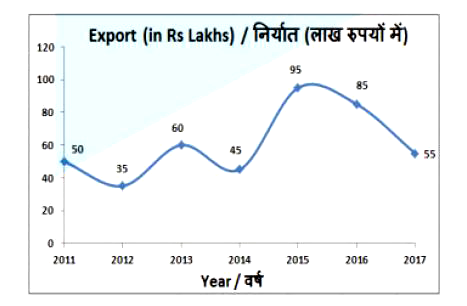
What was the difference in the exports (in Rs lakhs) between the years 2012 and 2014?View SolutionThe line graph shows the Sales per employee of a certain company. Study the diagram and answer the following questions.
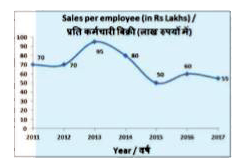
What was the difference in the Sales per employee (in Rs lakhs) between the years 2011 and 2015?View SolutionThe line graph shows the exprots by a certain company. Study the diagram and answer the following questions.
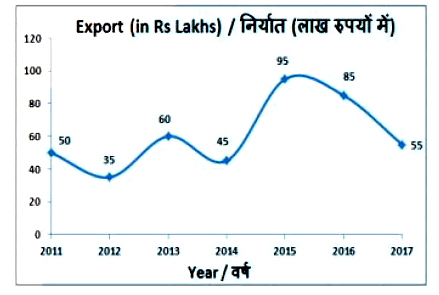
The exports in 2014 were lesser than that in 2011 by ________.View SolutionThe pie chart shows the breakup of expenditure of a software company for the year 2017. Study the diagram and answer the following questions.
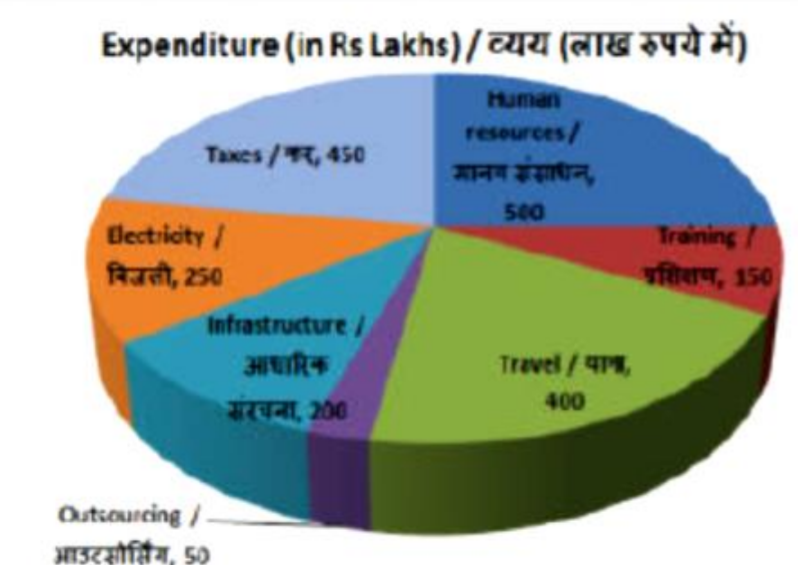
What is the total expenditure (in Rs lakhs)?View SolutionThe pie chart shows the breakup of expenditure of a mining company for the year 2017. Study the diagram and answer the following questions.
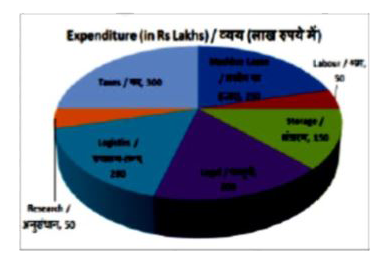
What is the total expenditure (in Rs lakhs)?View Solution

