Direction :- Given below is the pie chart which shows the percentage distribution of a book 'XYZ'.
Published in 5 different stores.
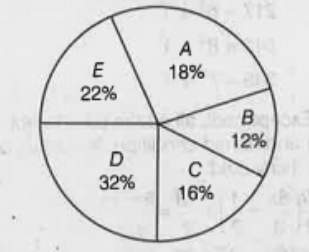
Total number of books = 550
Find the central angle for the book D.
117.5∘
115.2∘
112.8∘
108.5∘
Step by step video & image solution for Direction :- Given below is the pie chart which shows the percentage distribution of a book 'XYZ'. Published in 5 different stores. Total number of books = 550 Find the central angle for the book D. by Maths experts to help you in doubts & scoring excellent marks in Class 14 exams.
Updated on:21/07/2023Similar Questions
Direction: Study the following information carefully and answer the given questions: The following pie chart shows the percentage distribution of total number of Apples (Dry +dry)
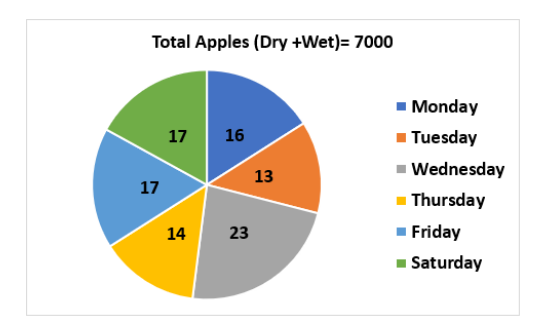
The pie chart2 shows the percentage distribution of total number of Apples (Wet) sold in different days of a week.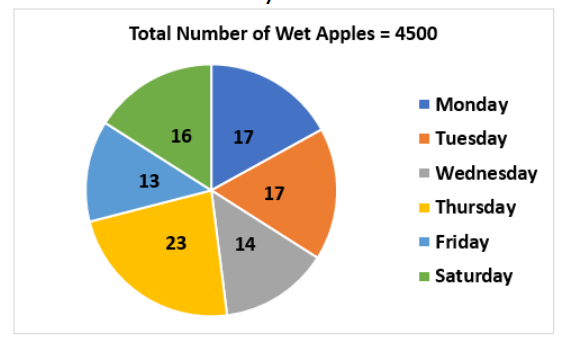
Find the difference the Apples (Wet) sold on Tuesday to the apples (Wet + Dry) sold on Thursday?
View SolutionTable shows the percentage distribution of the expenditure incurred on different items for publishing a book.
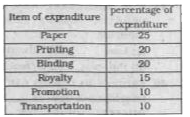
Expenditure on Promotion is less than that on the Paper by:
View Solution
Knowledge Check
Direction: The following pie chart shows the percentage of production of books by different companies in a year. Read the chart and answers the following questions.
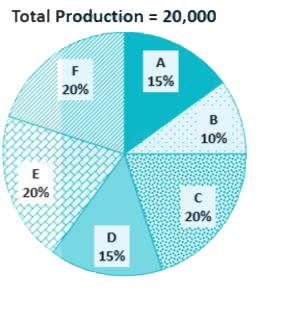
Find the average production of books by company B and C:A6000B3000C4000D5000The following pie-chart shows the percentage distribution of the expenditure incurred in publishing a book. Study the pie-chart and answer the questions based on it.
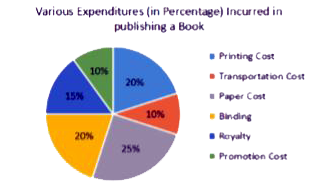
What is the central angle of the sector corresponding to the expenditure incurred on binding?A72∘B90∘C48∘D70∘The given pie chart shows the percentage distribution of 450 employees in an organisation. Study the pie chart and answer the question that follows
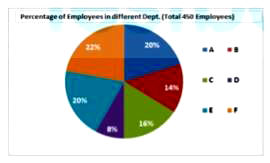
What is the central angle of the sector representing the number of employees in department A ?A72∘B108∘C90∘D36∘
Directions: Study the Pie chart and answer the following question. The pie chart is showing the percentage of different types of shirts sold by five different stores namely A, B, C, D and E.
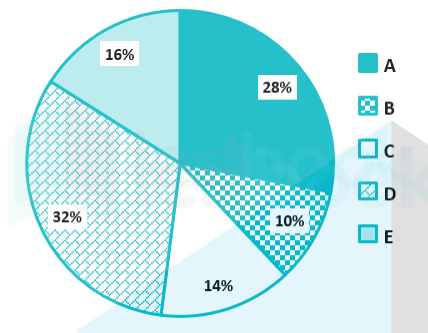
Find the average of shirt sold by all stores. If the shirt sold by store B is 1750.
View SolutionDirections: Study the Pie chart and answer the following question. The pie chart is showing the percentage of different types of shirts sold by five different stores namely A, B, C, D and E.

Find the average of shirt sold by store D and E, if the shirt sold by E is 256
View SolutionDirection: Study the following information carefully and answer the given questions: The following pie chart shows the percentage distribution of total number of Apples (Wet +dry)

The pie chart2 shows the percentage distribution of total number of Apples (Wet) sold in different days of a week.
If the Apples (dry) sold on Sunday is 60 % more than the Apples (dry) sold on Saturday. Find the total Apples (dry) sold on Sunday and Saturday together?
View SolutionTable shows the percentage distribution of the expenditure incurred on different items for publishing a book.
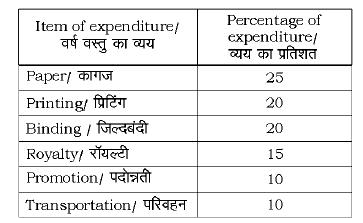
Expenditure on Royalty is less than that on printing by:
View SolutionThe pie-chart shows the percentage-wise distribution of the number of students in five different schools P,Q,R,S and T .
The total number of students in all five schools together is 10,500 .
Study the pie -chart and answer the question .
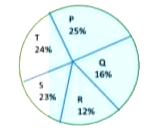
The difference between the central angles corresponding to schools T and R is :
View Solution
