Direction :- Number of toys five types (A to E) manufactured over the years (in thousands ) is given below. Study the table and answer the following questions.
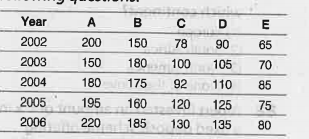
The approximate percentage increase in production of D type of toys from 2003 to 2005 was
0.05
0.19
0.29
0.25
Step by step video & image solution for Direction :- Number of toys five types (A to E) manufactured over the years (in thousands ) is given below. Study the table and answer the following questions. The approximate percentage increase in production of D type of toys from 2003 to 2005 was by Maths experts to help you in doubts & scoring excellent marks in Class 14 exams.
Updated on:21/07/2023Similar Questions
Direction :- Number of toys five types (A to E) manufactured over the years (in thousands ) is given below. Study the table and answer the following questions.
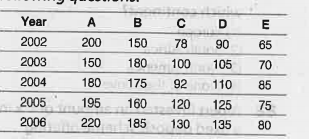
The percentage drop in production of A type of toys from 2002 to 2004 was
View SolutionStudy the following graph and answer the questions given below it.
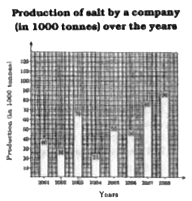
What was the percentage decline in the product of salt from 2003 to 2004 ?
View Solution
Knowledge Check
The following graph shows production (in thousands) of two types (P and Q) of vehicles by a factory over the years 2009 to 2014. Study the graph and answer the given questions.
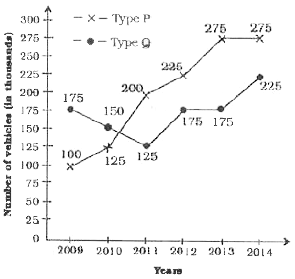
Approximate percentage decrease in production of Type Q vehicles from 2010 to 2011 isA10.1B16.7C14.3D12.5Study the table carefully to answer the following questions ----
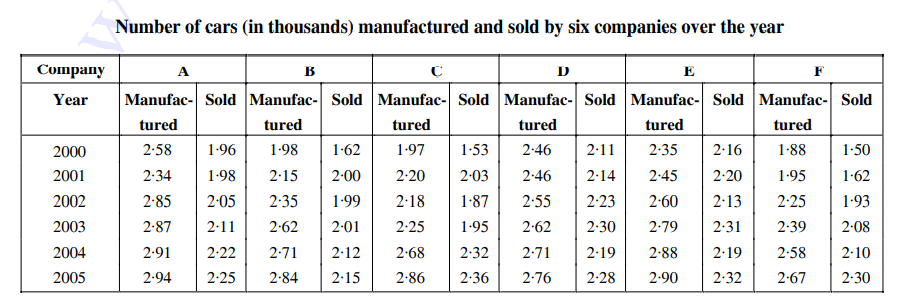
What is the approximate percent increase in the number of cars sold by company F in the year 2004 from the previous year ?A13B19C0.96D8Study the following graph carefully to answer the questions given below.
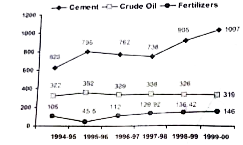
Find the approximate percentage increase in Cement production from 1994-95 to 1999-00 ?A0.55B0.6C0.65D0.69
The following graph shows the production of wheat flour (in 1000 tonnes) by three companies X, Y and Z over the years. Study the graph and answer the questions.
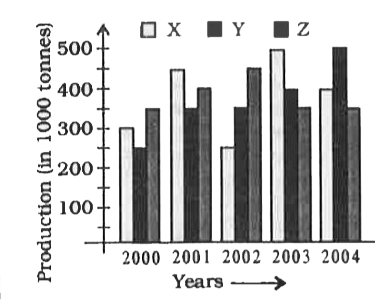
What is the percentage Increase in the production of company Y from 2002 to 2003?
View SolutionThe given table shows the number (in thousands) of cars of five different models A, B, C, D and E produced during years 2012-2017. Study the table and answer the questions that follow.
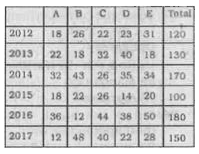
The percentage decrease in the production of which type of car in 2017, with reference to 2016, was the maximum
View SolutionThe table given here shows production of five types of cars by a company in the year 1989 to 1994. Study the table and answer questions
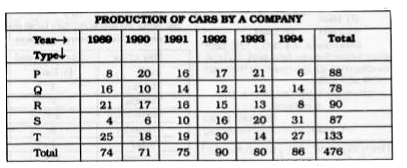
The percent increased in total production of all types of cars in 1992 to that in 1991 was :
View SolutionDirection∶ The given table shows the number (in thousands) of cars of five different models A, B, C, D and E produced during years 2012-2017. Study the table and answer the question that follow.
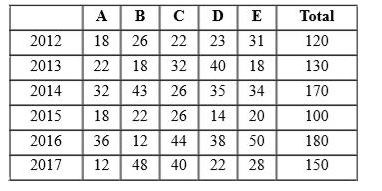
The percentage decrease in the production of which type of car in 2017, with reference to 2016, was the maximum?
View SolutionThe table shows the production of different types of cars by a company (in thousands) in 5 years. Study the table and answer the questions.
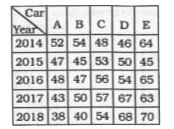
The average production of type D cars in 5 years is what per cent less than the production of type E cars in 2018 ? (Correct to one decimal place)
View Solution
