Direction :- Study of bar graph and answer the questions.

From 2001 to 2006, the total number of people who preferred to play Football I was that (in millions)?
(A) 1525 (B) 1620 (C) 1730 (D) 1800
B
D
A
C
Step by step video & image solution for Direction :- Study of bar graph and answer the questions. From 2001 to 2006, the total number of people who preferred to play Football I was that (in millions)? (A) 1525 (B) 1620 (C) 1730 (D) 1800 by Maths experts to help you in doubts & scoring excellent marks in Class 14 exams.
Updated on:21/07/2023Similar Questions
Study the bar graph given below and answer the following questions.
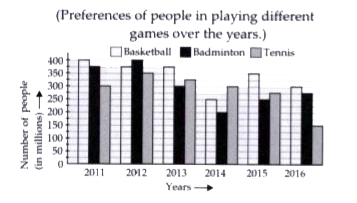
From 2011 to 2016, find the difference between the total number of people who preferred to play Basketball and Badminton (in millions) ?
View SolutionStudy the given graph carefully and answer the following questions.
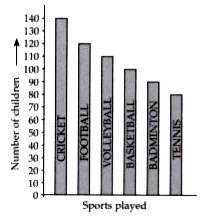
What fraction of the total number of children plays football ?
View Solution
Knowledge Check
Study the following graph carefully and answer the question given below.
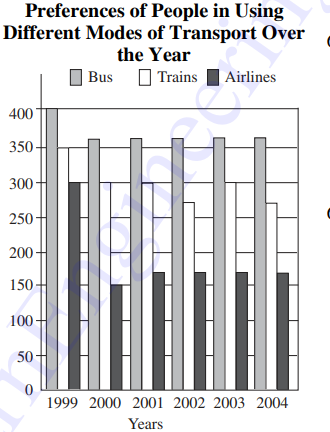 From 1999 to 2004, the total number of people who preferred to travel by trains, was approximately how many millions? A1300B1800C1600D1700
Study the bar diagram and answer the questions.
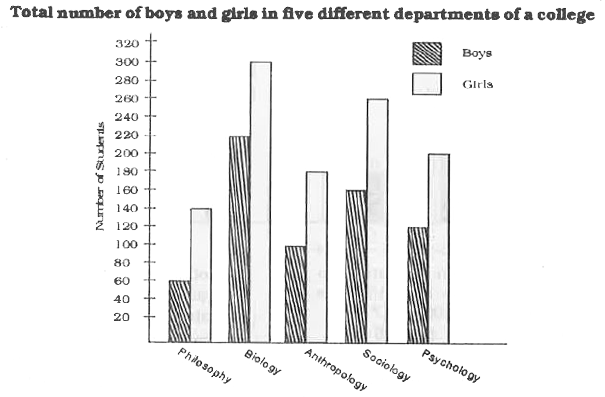
The difference between the total number of bys and the total number of girls from all the Departments together isA540B520C460D440
Observe the bar graph and answer the following questions.
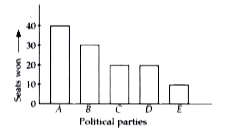
What is the total number of seats won by party A and party B?
View SolutionDirection :- Study of bar graph and answer the questions.
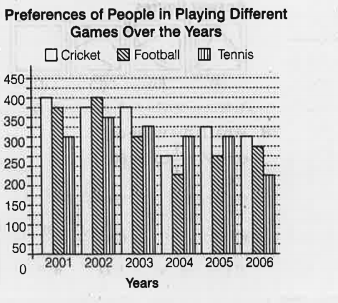
What is the respective ratio of the number of people preferring to play Cricket to the number of people, preferring to play Tennis in the year 2003?
(A)14:15 (B) 15:13 (C) 15:17 (D) 13:15
View SolutionDirection :- Study of bar graph and answer the questions.
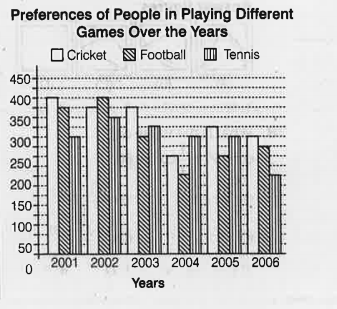
The number of people prefering to play Tennis in 2006, is how many millions fewer than the number of people prefering to play Tennis in 2005?
(A) 115 (B) 120 (C) 100 (D) 97
View SolutionStudy the bar graph and answer the following questions.
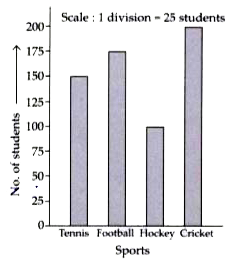
What is the difference between number of students playing football and hockey ?
View Solution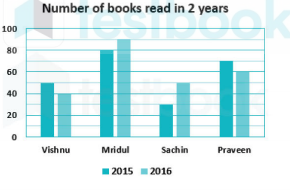
Directions: Read the bar graph carefully and answer the given questions.What is the average of total number of books read by all of them in the year 2016?
View SolutionStudy the bar graph given below and answer the following questions.
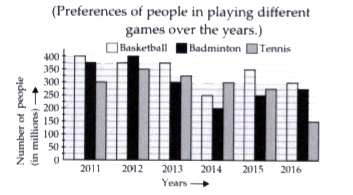
How many people (in millions) have preferred to play Tennis in all years altogether ?
View Solution
