The following questions are based on the information given below. Read the information given below and answer the question that follow: Information about the Number of Candidates who appeared, qualified and then were selected in a Competitive Examination from Delhi over the years 1997 to 2001 is given below:
 For which year is the ratio of number of candidates who were selected to the number of candidates who qualified the highest?
(A) 1998 (B) 2000 (C ) 2001 (D) 1999
A
C
D
B
Step by step video & image solution for The following questions are based on the information given below. Read the information given below and answer the question that follow: Information about the Number of Candidates who appeared, qualified and then were selected in a Competitive Examination from Delhi over the years 1997 to 2001 is given below: For which year is the ratio of number of candidates who were selected to the number of candidates who qualified the highest? (A) 1998 (B) 2000 (C ) 2001 (D) 1999 by Reasoning experts to help you in doubts & scoring excellent marks in Class 14 exams.
Updated on:21/07/2023Similar Questions
The following questions are based on the information given below. Read the information given below and answer the question that follow: Information about the Number of Candidates who appeared, qualified and then were selected in a Competitive Examination from Delhi over the years 1997 to 2001 is given below:
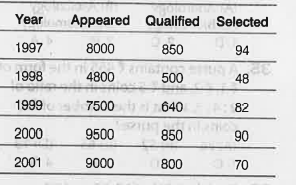 What is the average numer of candidates selected over the given period (round it to the nearest integers)?
(A) 79 (B) 77 (C ) 76 (D) 74
View SolutionRead the bar graph given below and answer the following questions:
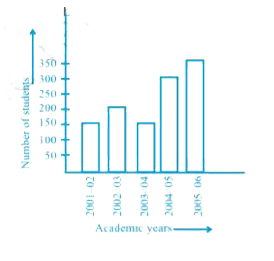
What information is given by the þar graph?
View Solution
Knowledge Check
Read the information given below and answer the questions that follow:
Following table gives the data on the number of students who appeared, qualified and were selected from various states in a national level exam.
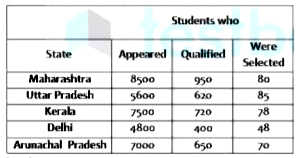
Which State has the highest ratio of number of students selected to the who qualified selectedAMaharashtraBDelhiCUttar PradeshDKeralaRead the information given below and answer the questions that follow:
Following table gives the data on the number of students who appeared, qualified and were selected from various states in a national level exam.
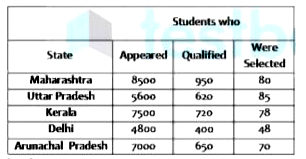
Which State has the highest ratio of number of students selected to the number of students who appeared from that State?AMaharashtraBDelhiCUttar PradeshDKeralaRead the information given below and answer the questions that follow:
Following table gives the data on the number of students who appeared, qualified and were selected from various states in a national level exam.
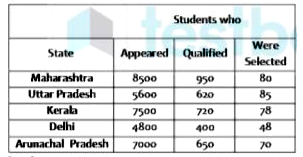
What percentage of students who appeared in the exam were selected?A1.08%B0.90%C1.2%D2.11%
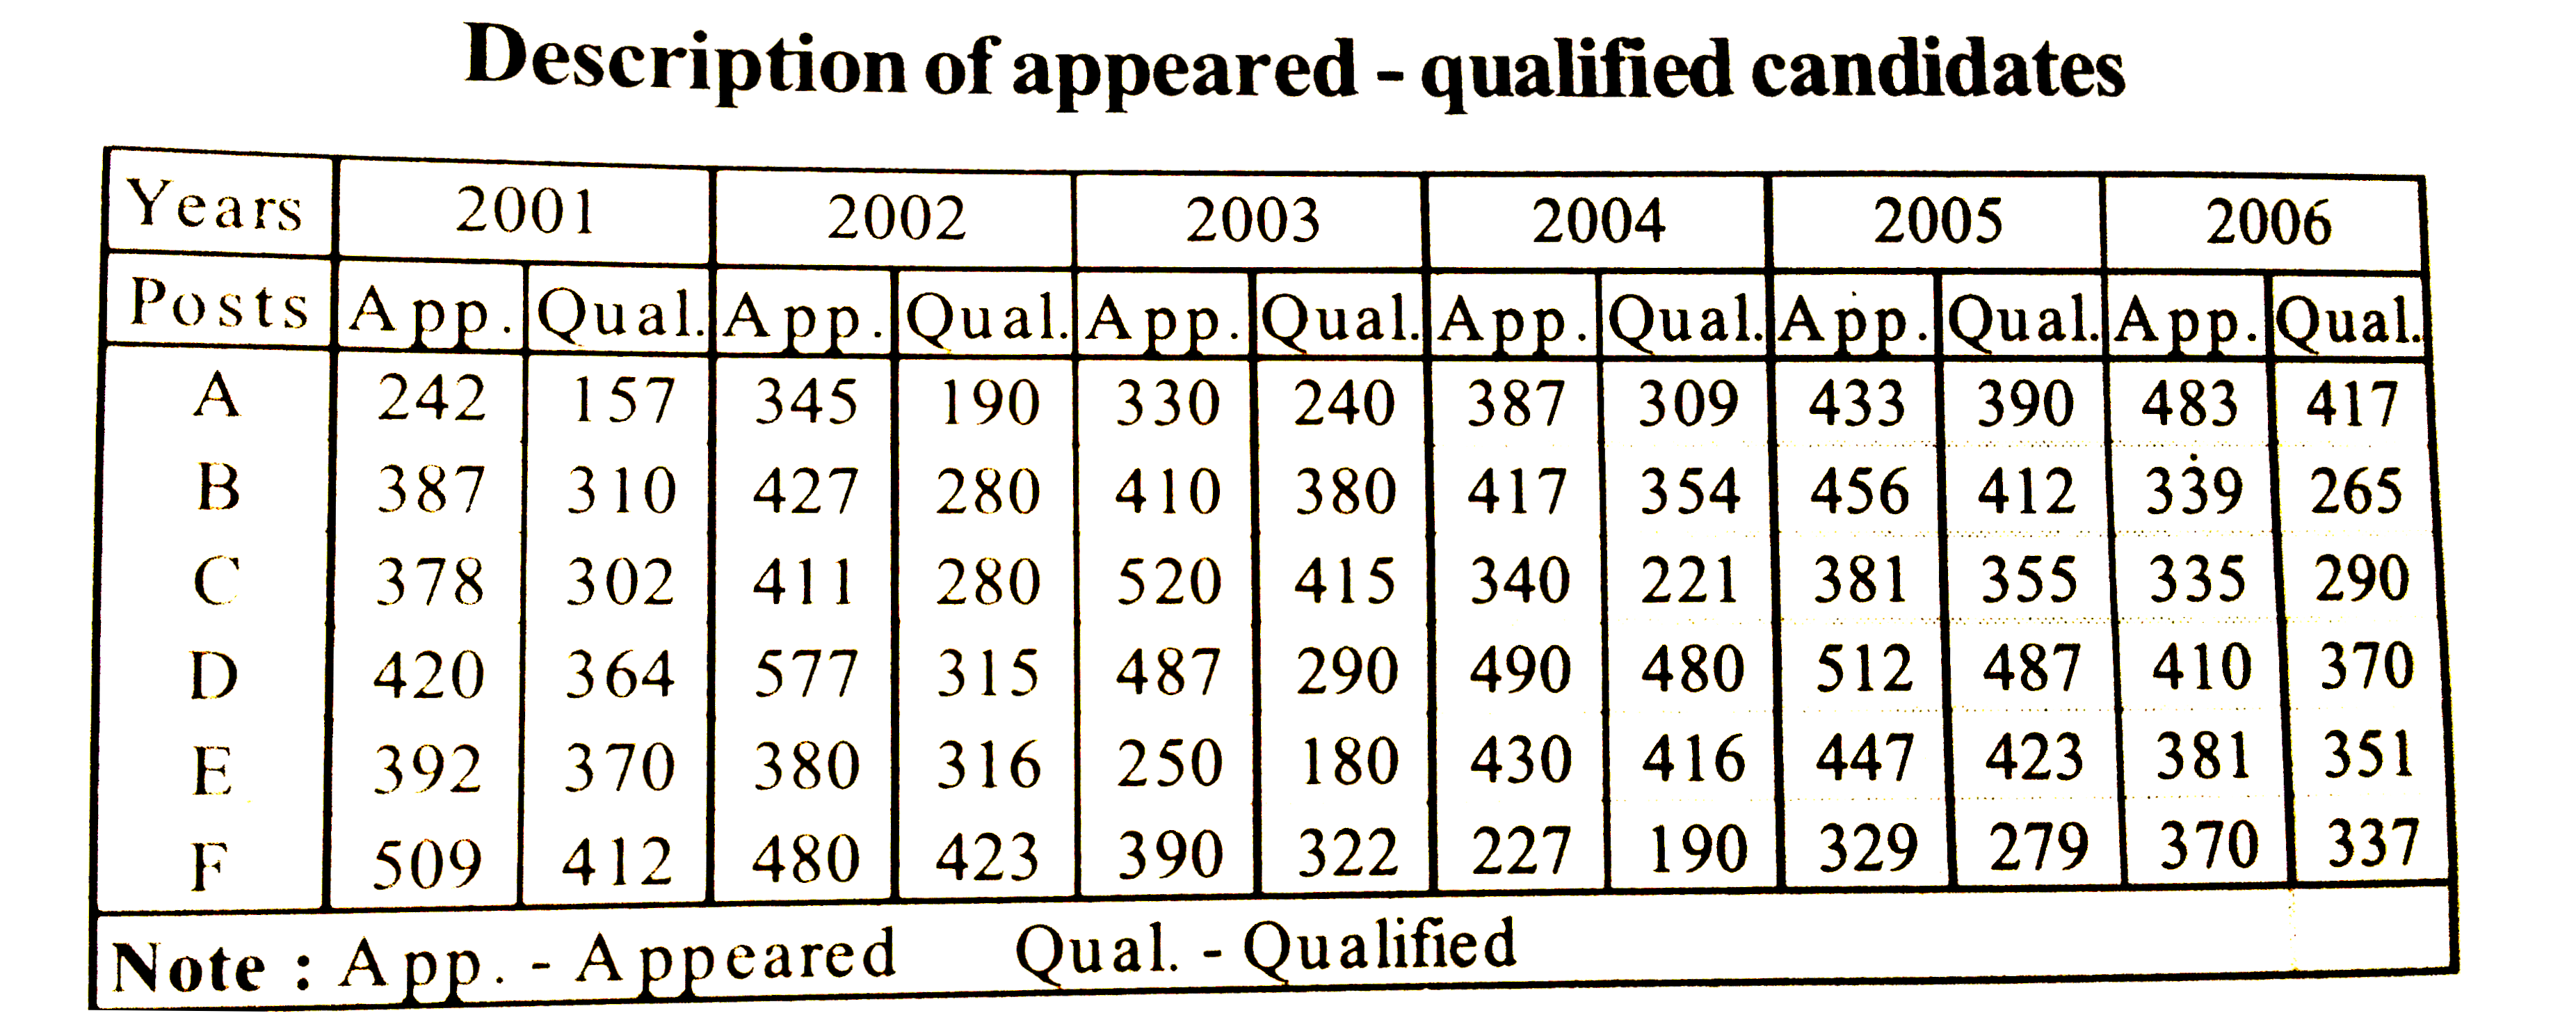
The average number of candidates who qualified for all the posts in the year 2004 is
View SolutionRead the bar graph given below and answer the following questions:

In which year is the number of students maximum?
View SolutionRead the information given below and answer the questions that follow:
Following table gives the data on the number of students who appeared, qualified and were selected from various states in a national level exam.
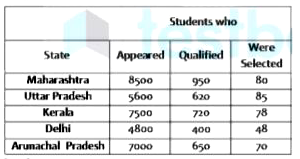
Which State has the lowest percentage of qualifications over those who had appeared?
View SolutionStudy the following graph carefully and answer the question given below
Number of candidates appeared (in thousand) and percentage of candidates qualified in a competitive examination over the years.
No. of candidates appeared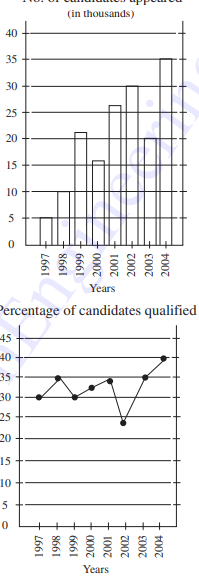
What was the ratio between the number of candidates appeared in 1997 and the number of candidates qualified in 2004?
View SolutionStudy the following graph carefully and answer the question given below
Number of candidates appeared (in thousand) and percentage of candidates qualified in a competitive examination over the years.
No. of candidates appeared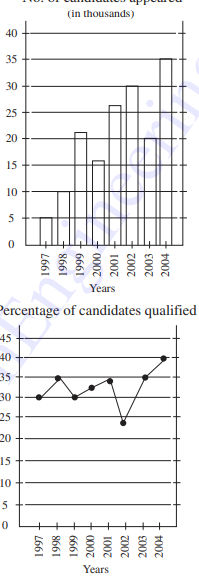
In which of the following years was the number of candidates qualified the lowest among the given years?
View Solution
