Study the following table carefully and answer the question given below it.
Number of executives recruited by six different organisation over the years.
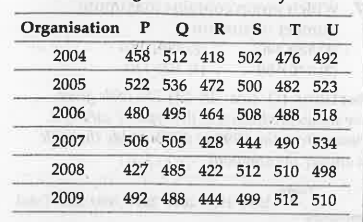
The number of executives recruited by organisation T in the year 2008 forms approximately what per cent of the total number of executives recruited by all the organisations together in that year?
0.11
0.31
0.18
0.26
Step by step video & image solution for Study the following table carefully and answer the question given below it. Number of executives recruited by six different organisation over the years. The number of executives recruited by organisation T in the year 2008 forms approximately what per cent of the total number of executives recruited by all the organisations together in that year? by Maths experts to help you in doubts & scoring excellent marks in Class 14 exams.
Updated on:21/07/2023Similar Questions
Study the following table carefully and answer the question given below it.
Number of executives recruited by six different organisation over the years.
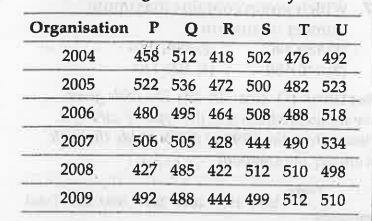
What is the average number of executives recruited by organisation S over all the years together?
View SolutionRead the following graph carefully and answer the questions given below:
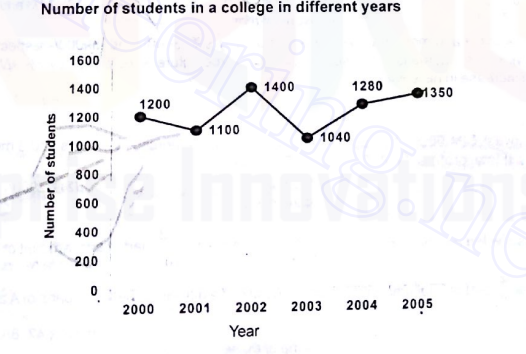
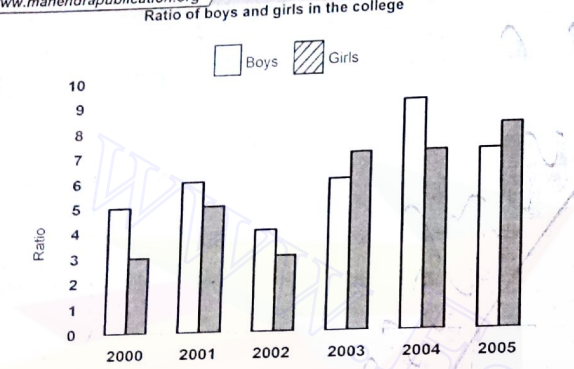
What is the average number of girls in all the years?
View Solution
Knowledge Check
Study the following graph carefully and answer the questions given below it :-
Number of people working in various departments of two different organisation:
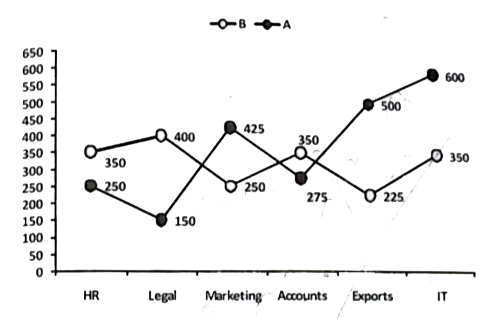
What is the total number of people working in organisation B?A1925B1950C1975D1875Study the following graph carefully and answer the questions given below it :-
Number of people working in various departments of two different organisation:
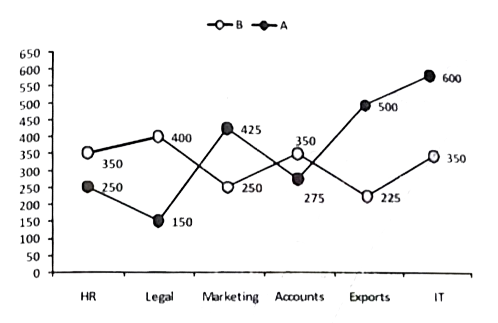
The number of people working in legal department of organisation B is approximately what percent of the total number of people working in organisation A?A29.19%B9.09%C13.13%D18.18%Study the following line chart carefully and answer the questions given below it. The following line chart represents the number of employees recrulted in different years in a company.
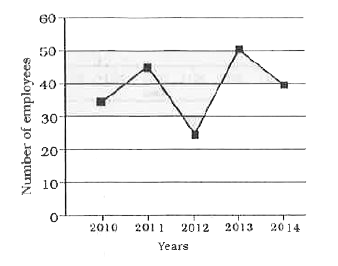
The number of employees recruited in the year 2012 was what percent of the number employees recruited in the year 2014 ?A50%B60%C62.5%D70%
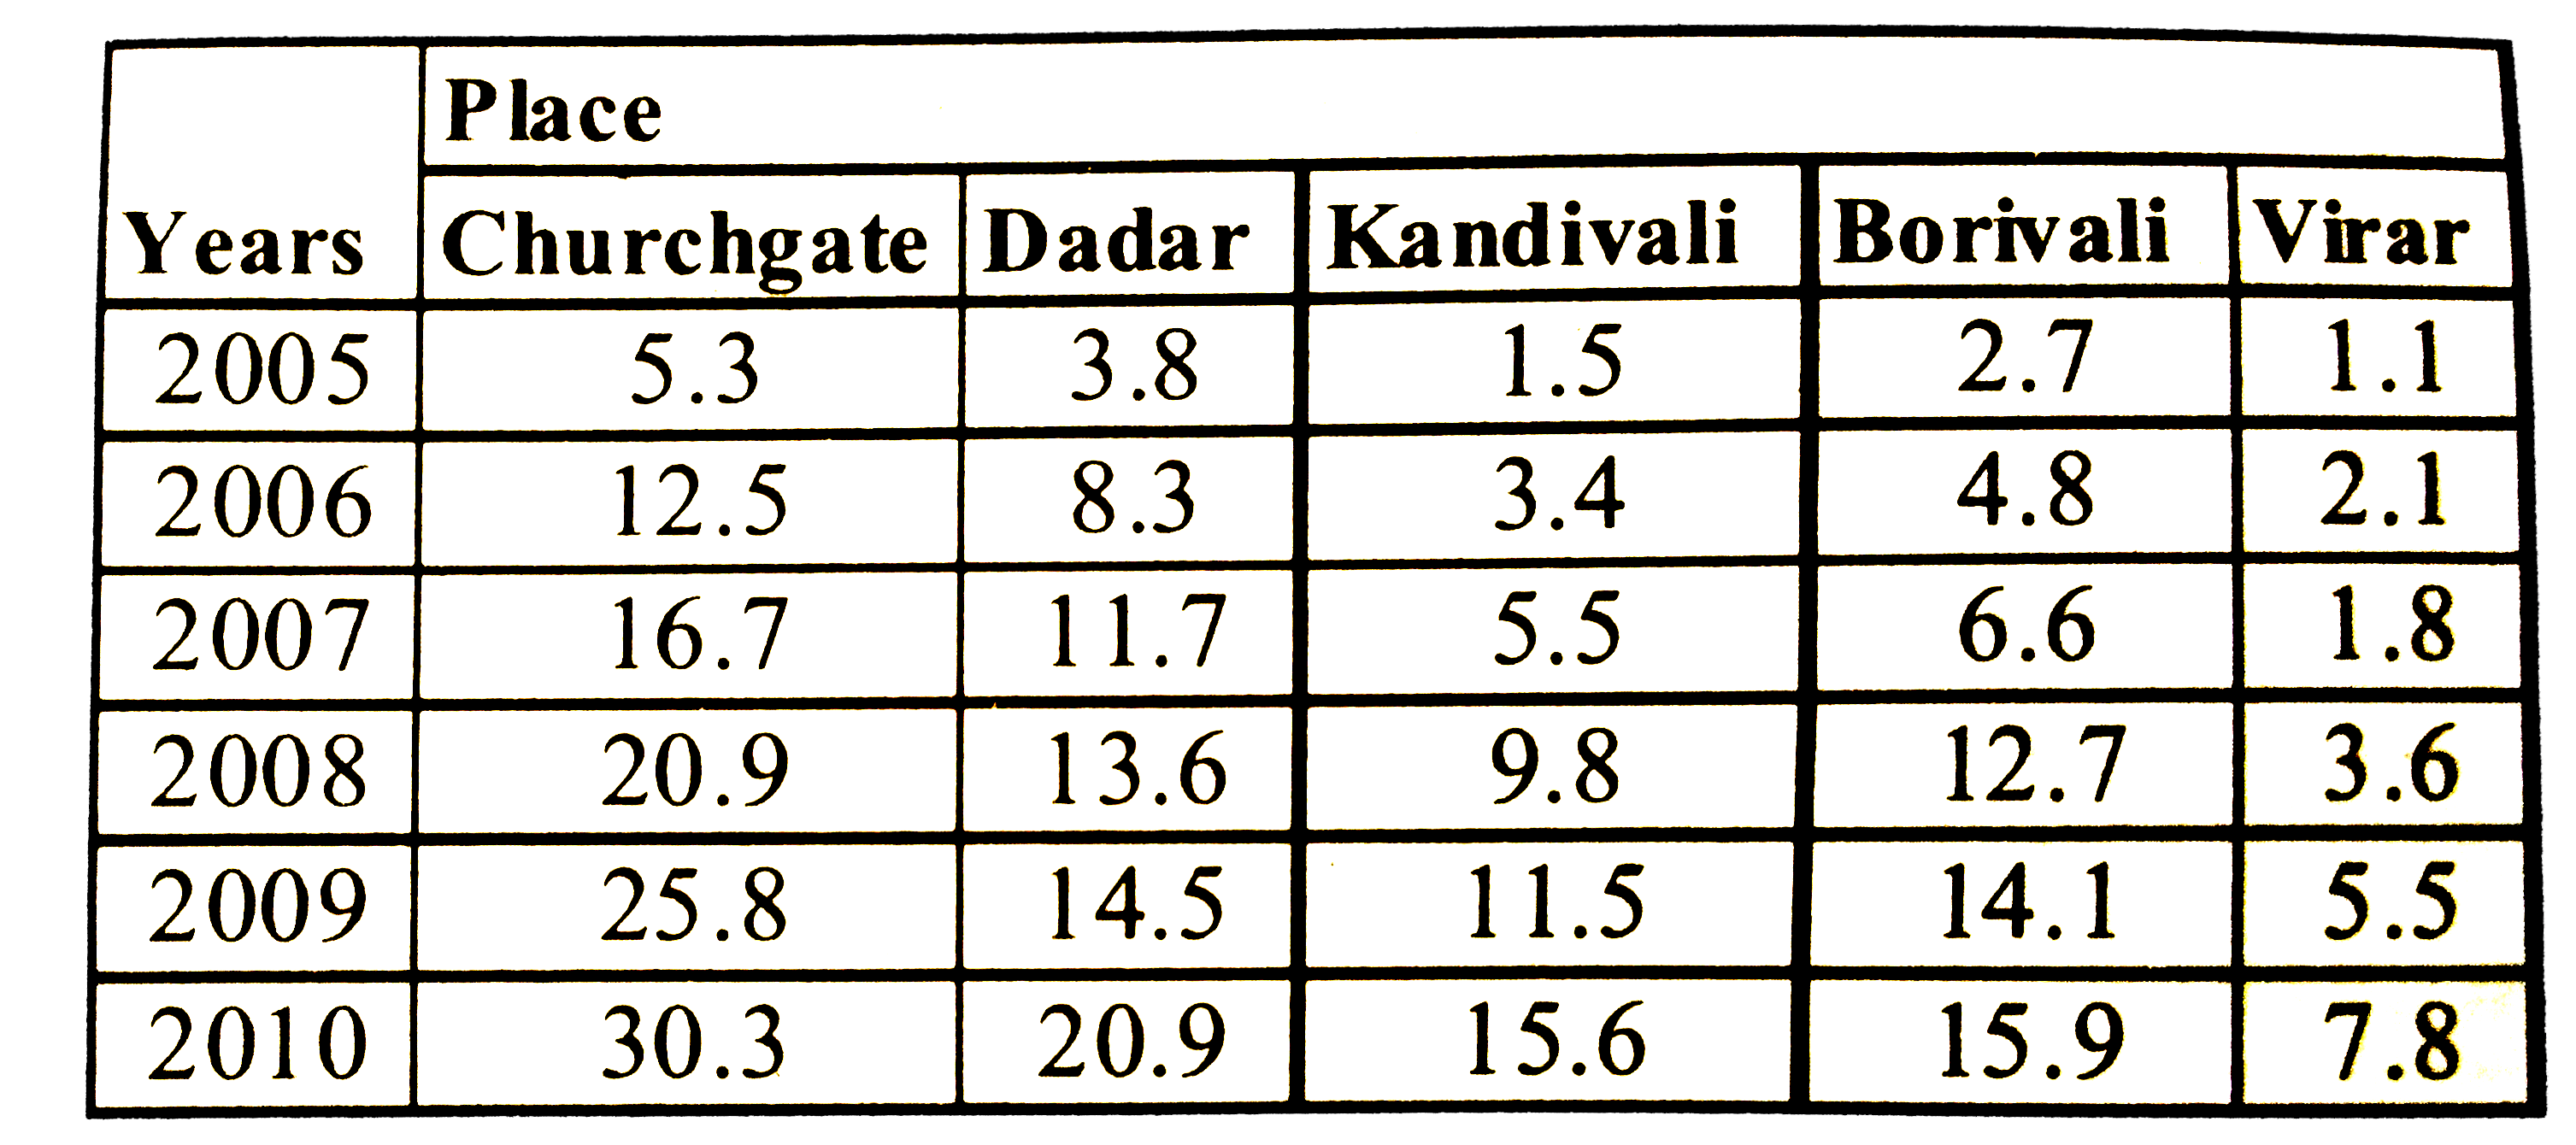
Monthly rent at Kandivali in the year 2008 was approximately what per cent of the total monthly rent at Virar over all the years together ?
View SolutionRead the following graph carefully and answer the questions given below:


What is the difference between the number of boys and girls in the year 2004 ?
View SolutionStudy the following line chart carefuly and answer the question given below. The following line chart represents the number of employee recruited in different years in a company.

The number of employees recruited in year 2012 was what percent of the number of emplyees recruited in year 2014.
View SolutionStudy the following graph carefully and answer the questions given below :
Number of students studying in different University in a year (Number in lakhs)
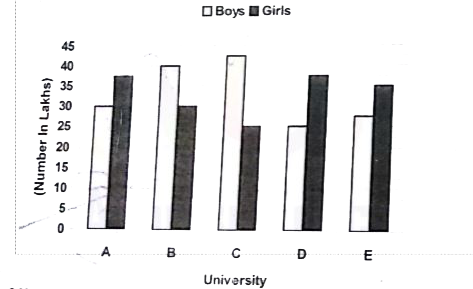
What is the average number of boys in all university together ?
View SolutionStudy the following table carefully to answer these questions ---
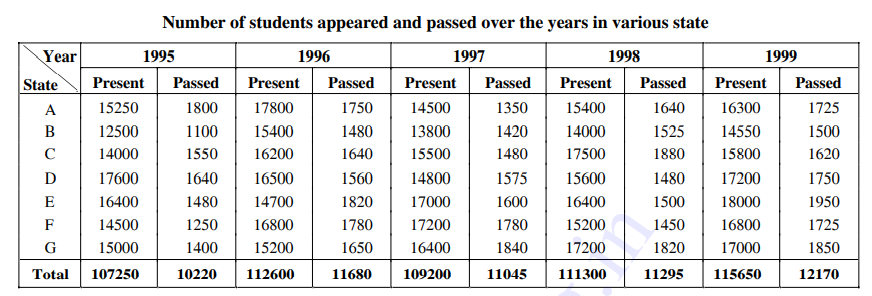
What is the average number of students appeared in B for all years ?
View Solution
