Study the following graph carefully and answer the question given below it.
Production and sale of printers of various companies in a month.
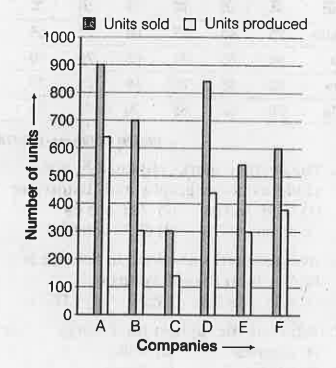
Which company had the highest percentage of sale with respect to its production ?
D
E
A
C
Step by step video & image solution for Study the following graph carefully and answer the question given below it. Production and sale of printers of various companies in a month. Which company had the highest percentage of sale with respect to its production ? by Maths experts to help you in doubts & scoring excellent marks in Class 14 exams.
Updated on:21/07/2023Similar Questions
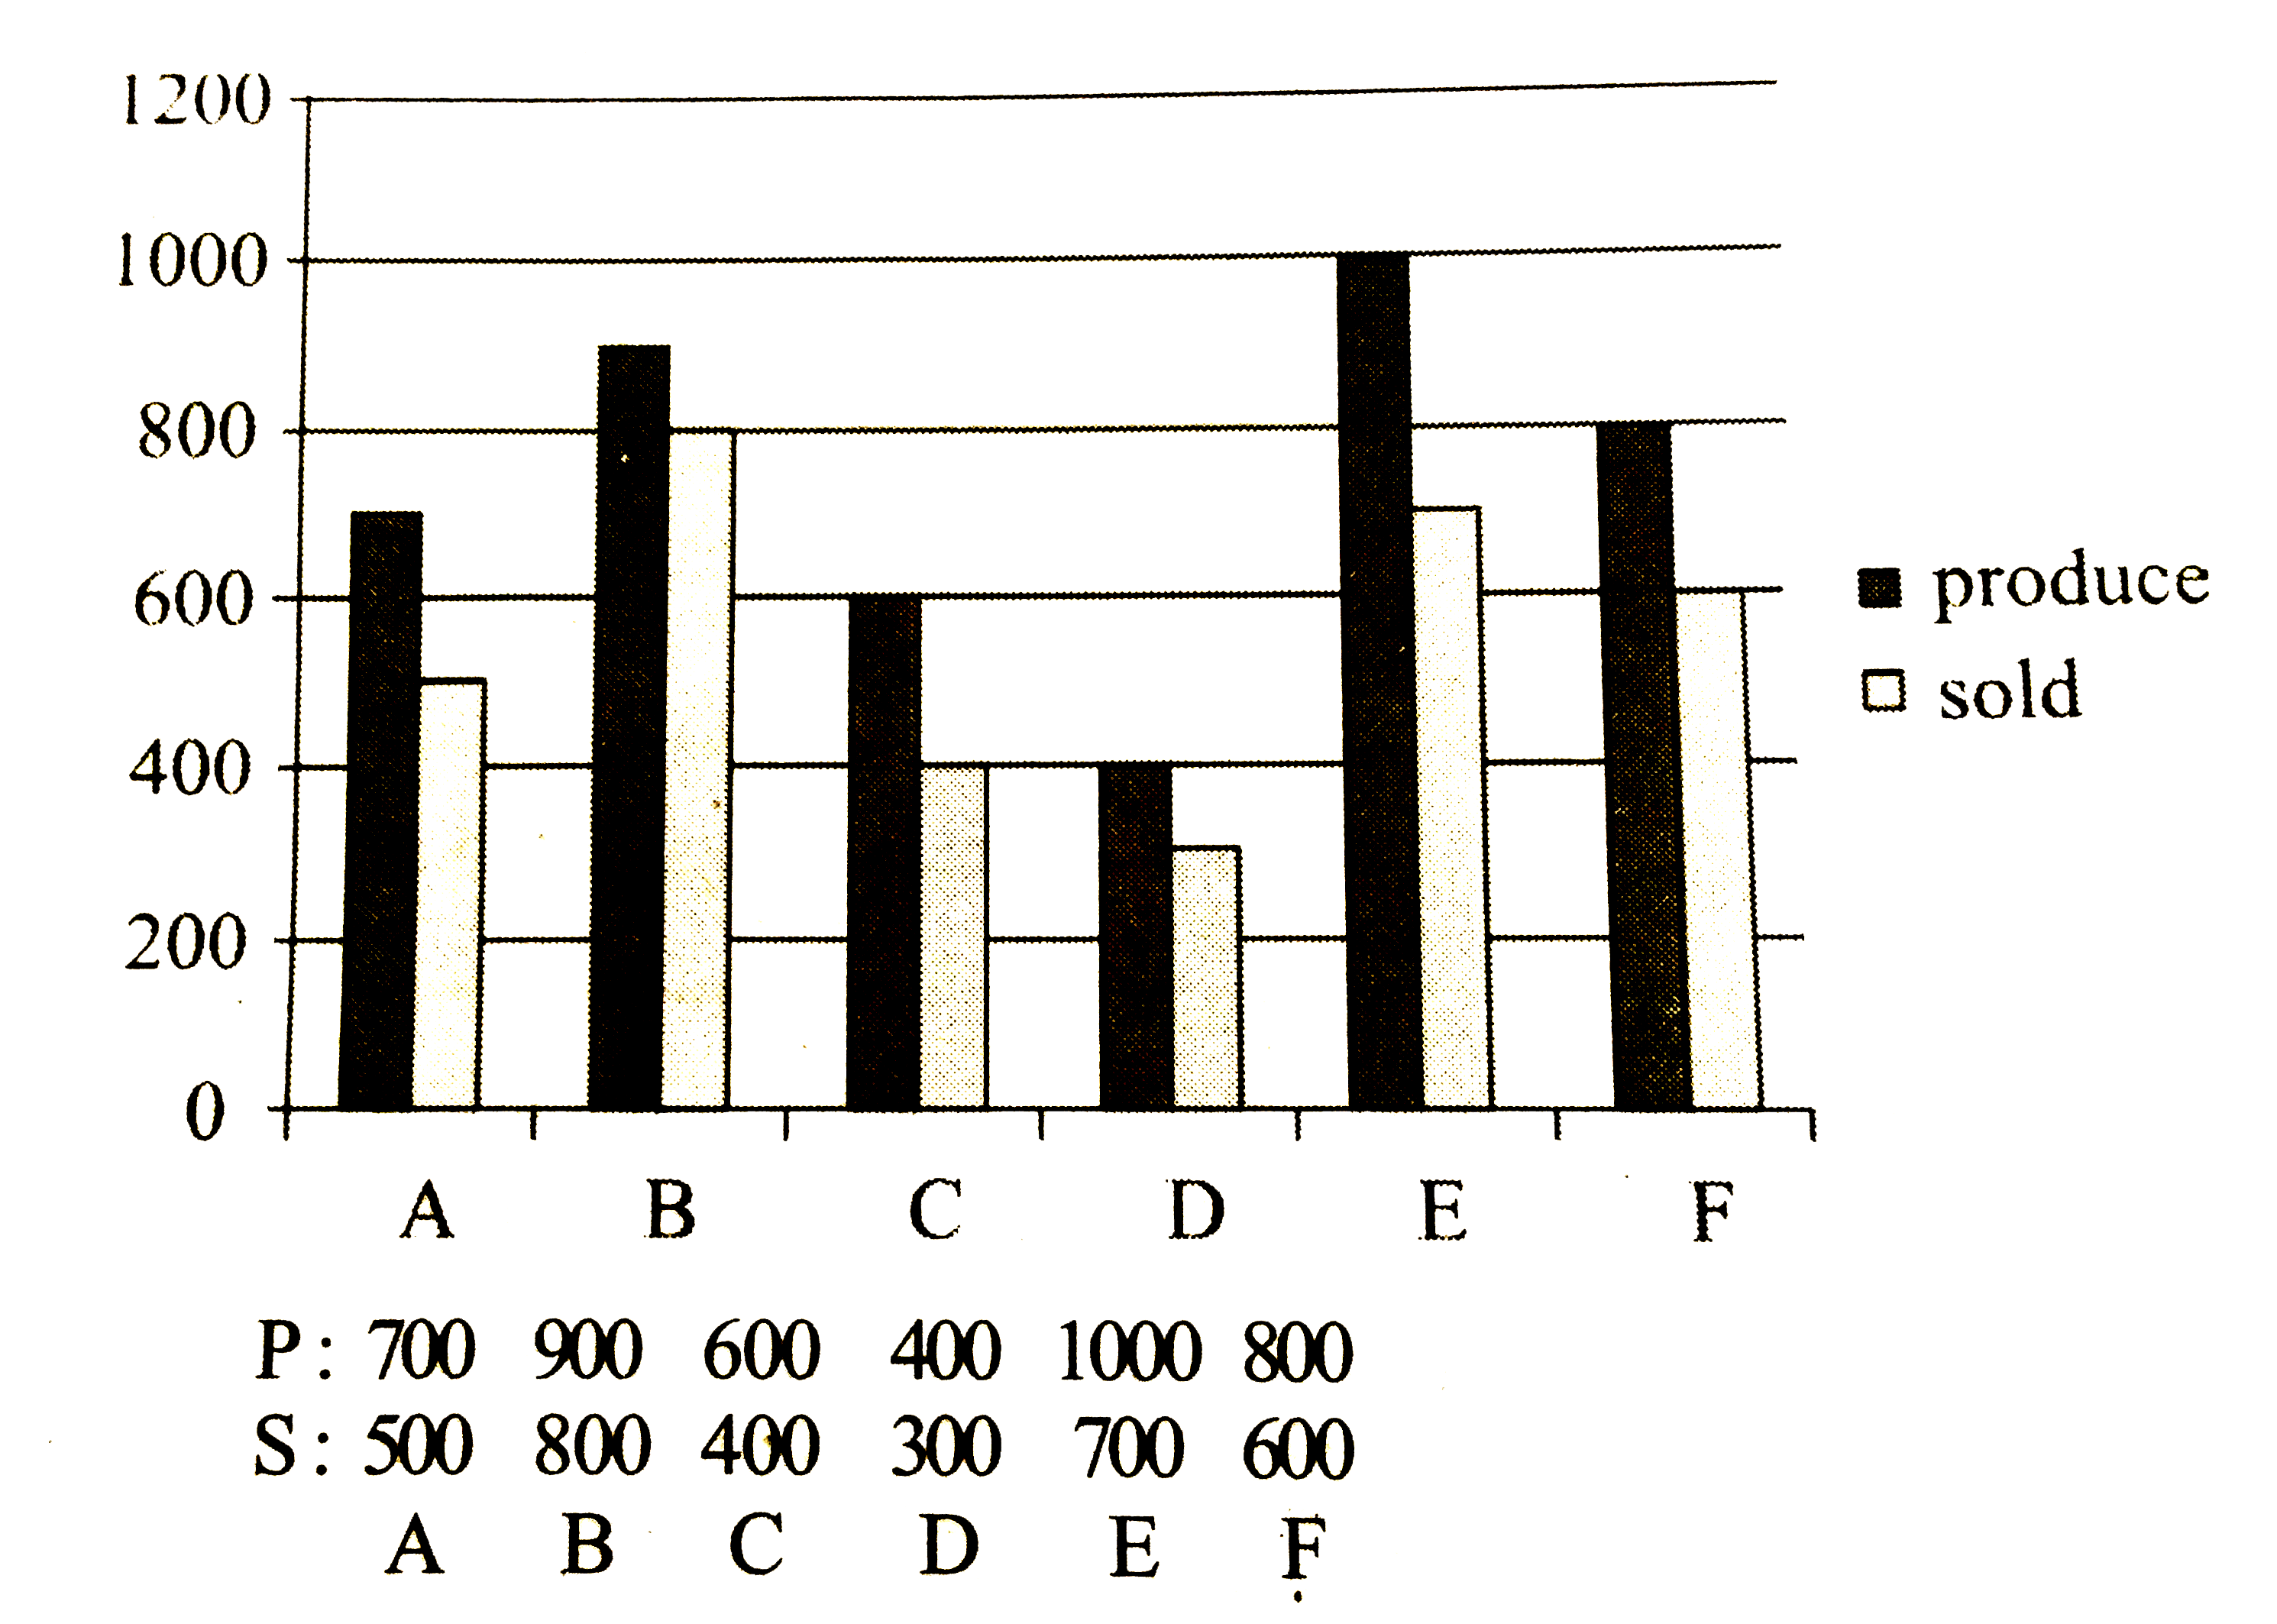
Which company had the lowest percentage of sales with respect to its production ?
View SolutionStudy the following graph carefully and answer the question given below it.
Production and sale of printers of various companies in a month.
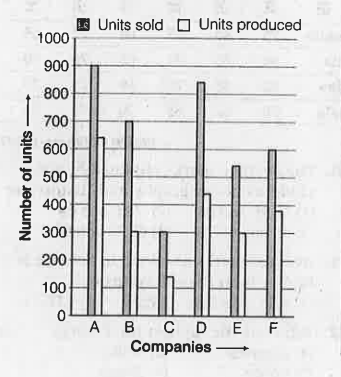
The total produced by the companies A B and C together is
View Solution
Knowledge Check
The Bar Graph shows the production and sales of Mobile handsets of various campanies A,B,C,D,E & F in a month.
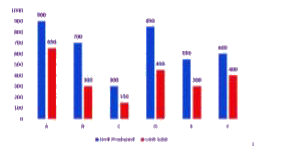
Which Company had the highest percentage of sale with respect to its production?AABDCEDBStudy the following graph carefully and answer the question given below-----
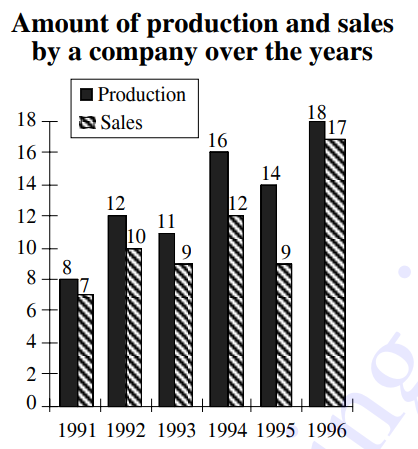
What was the percentage drop in sales from 1992 to 1993 ?A1B10C20D15Study the following graph carefully and answer the question given below-----
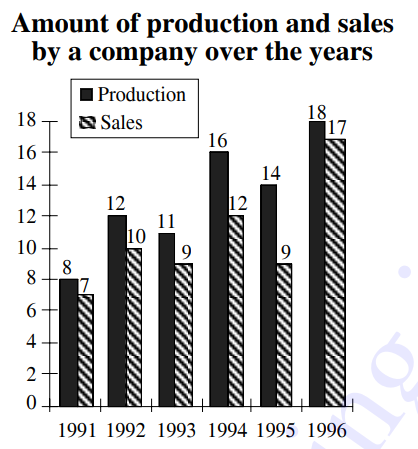
What was the difference between the sales of 1992 and 1995 ?A10 lakh tonnesB50 thousand tonnesC1 lakh tonnesD75 thousand tonnes
Study the following graph carefully and answer the question given below it.
Production and sale of printers of various companies in a month.
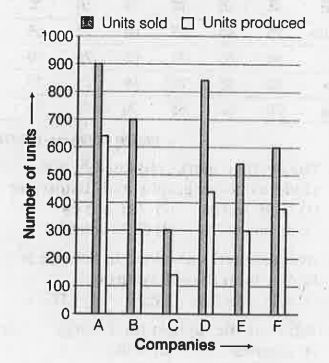
What is the average number of units produced by all the companies together?
View SolutionStudy the following graph carefully and answer the question given below it.
Production and sale of printers of various companies in a month.
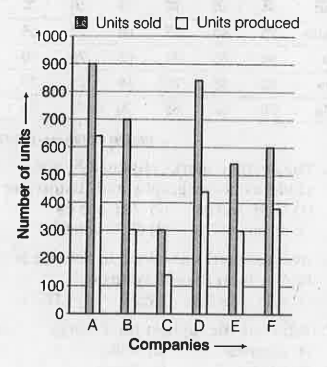
What is the ratio of the total production of companies D and E to the total sale of the same companies?
View SolutionRead the following graph carefully and answer the questions given below.
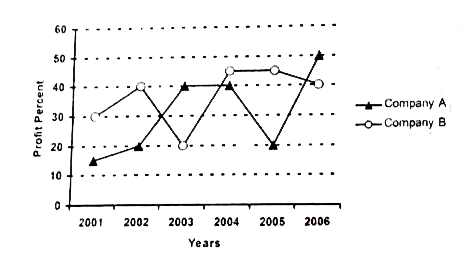
In which year the average of the profit percent of the both companies was the maximum ?
View SolutionRead the following graph carefully and answer the questions given below.
Production of sugar in three different factories over years (in thousand tonnes)
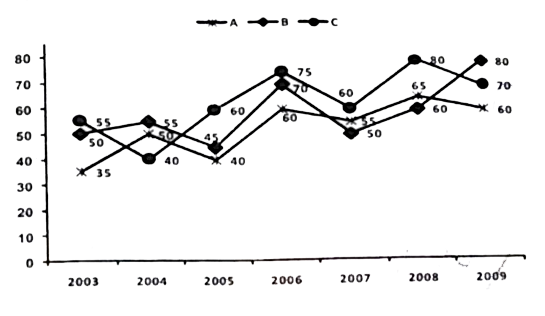
In which year was the percentage increase/decrease in production of company B maximum ?
View SolutionStudy the following graph carefully to answer the questions given below.
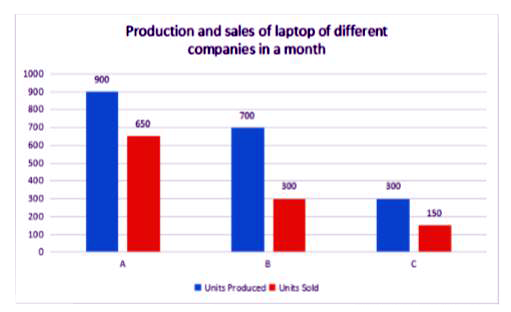
What is the average number of Units produced by all the Companies together?
View Solution
