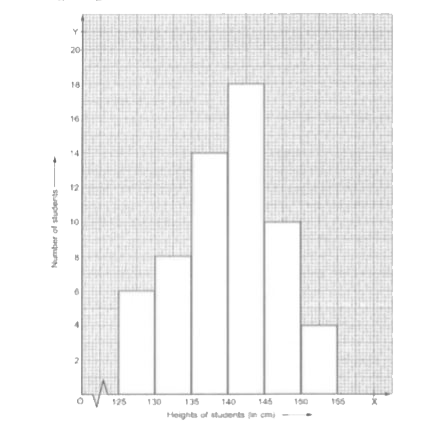
Following histogram depicts the range of heights of students in a class of 60 students. Study the same and answer the questions.
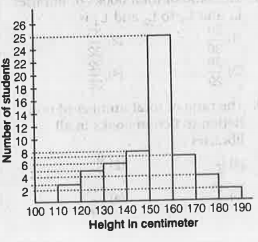
Which group contains maximum number of students ?
130-140
150-160
140-150
160-170
Step by step video & image solution for Following histogram depicts the range of heights of students in a class of 60 students. Study the same and answer the questions. Which group contains maximum number of students ? by Maths experts to help you in doubts & scoring excellent marks in Class 14 exams.
Updated on:21/07/2023Similar Questions
Following histogram depicts the range of heights of students in a class of 60 students. Study the same and answer the questions.
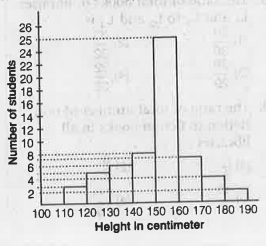
The number of students with their height between 130 cm and 140 cm, is
View SolutionFollowing histogram depicts the range of heights of students in a class of 60 students. Study the same and answer the questions.
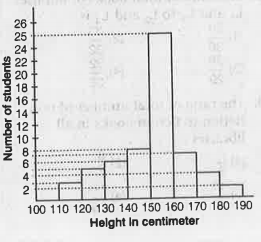
How many students have their heights more than 150 cm ?
View Solution
Knowledge Check
Following histogram depicts the range of heights of students in a class of 60 students. Study the same and answer the questions.
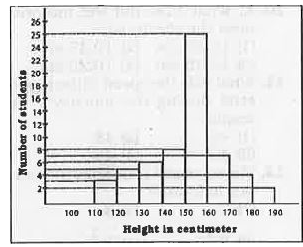
Group which contains maximum number of students isA130 - 140B150 - 160C140 - 150D160 - 170Following histogram depicts the range of heights of students in a class of 60 students. Study the same and answer the questions.
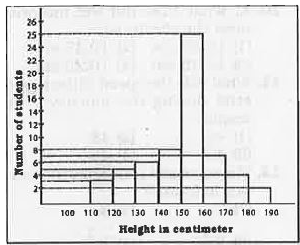
The number of students having their heights between 130 to 150 cms isA8B6C14D22Following histogram depicts the range of heights of students in a class of 60 students. Study the same and answer the questions.
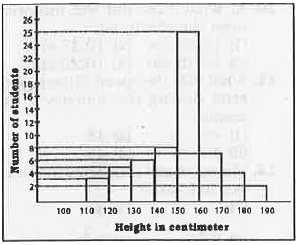
The number of students having height more than 150 cms isA25B8C38D13
The graph shows the result of 10th class students of a school for 4 years. Study the graph and answer the questions :
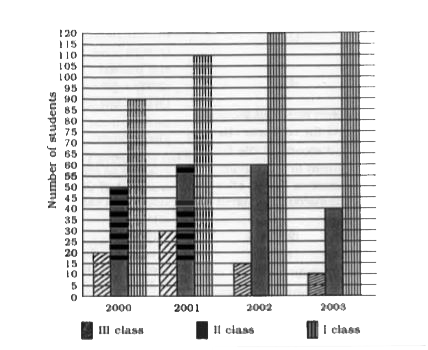
The year in which the maximum number of students appeared for the 10th class exam is
View SolutionThe given pictograph represents the number of students in 5 sections of class VI.
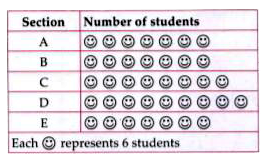
Study the given pictograph and answer the following questions.
Which section has 48 students ?
View SolutionLook at the histogram given below and answer the questions that follow:
Which class interval has the least number of students ?
View SolutionThe sub divided bar diagram given below depicts the result of Class XII students of a school for three years. Study the diagram and answer the questions given below :
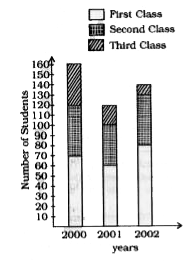
The number of students passed with Third class in th year 2002 is
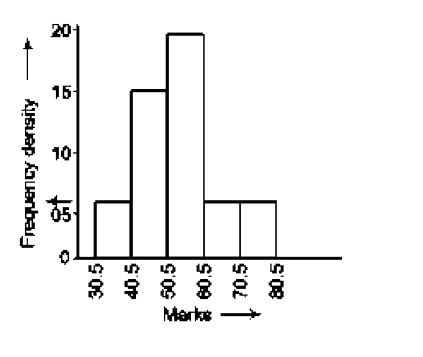
View SolutionThe class, in which the marks of maximum number of students lies, is
View Solution
