Consider the following data with regard to different types (I, II, III, IV, V) of multivitamin tablets produced in a company (in lakhs) :
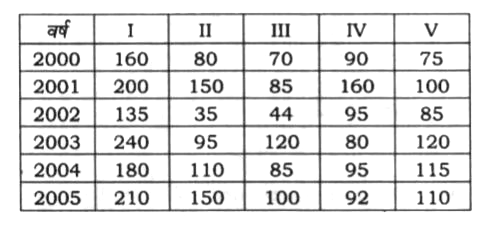
Which product is produced least over the years 2000-2005?
Type II
Type III
Type IV
Type V
Step by step video & image solution for Consider the following data with regard to different types (I, II, III, IV, V) of multivitamin tablets produced in a company (in lakhs) : Which product is produced least over the years 2000-2005? by Maths experts to help you in doubts & scoring excellent marks in Class 14 exams.
Updated on:21/07/2023Similar Questions
Consider the following data with regard to different types (I, II, III, IV, V) of multivitamin tablets produced in a company (in lakhs) :
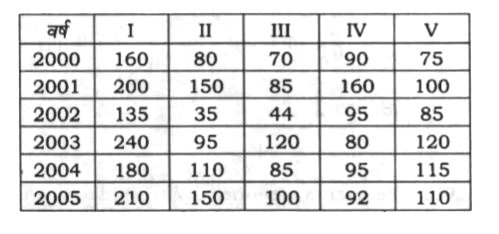
In which year, the production of Type I is more than the sum of the production of Type III and Type IV?
View SolutionConsider the following data with regard to different types (I, II, III, IV, V) of multivitamin tablets produced in a company (in lakhs) :
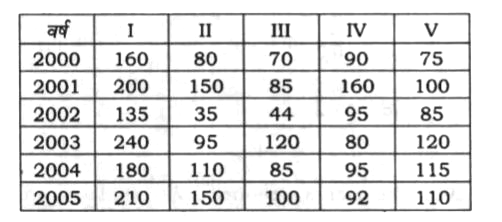
In which one of the following pairs of years, the difference in total number of tablets produced between them is minimum?
View Solution
Knowledge Check
Consider the following structures (I), (II), (III) and (IV).
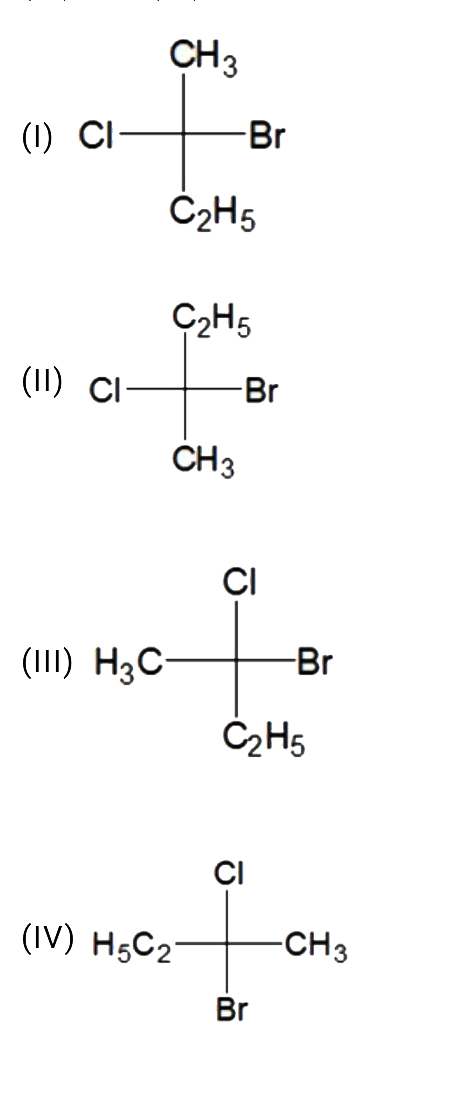
Which of the following statements is not correct?AII and III are identicalBI and II are enantiomersCI and III are enantiomersDII and IV are enantiomers.Study the following graph which shows the production (in thousand) of different items, and answer the questions.
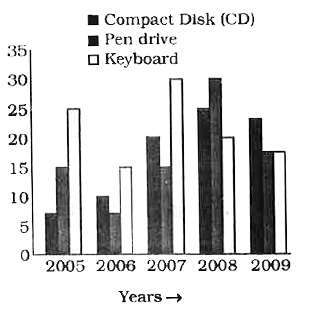
The total number of all products produced by the company in the year 2006 and 2008 together isA107500B105700C10750D1075
For the next four (4) items, consider the following data with regard to different types (I, II, III, IV, V) of multivitamin tablets produced in a company (in lakhs) :
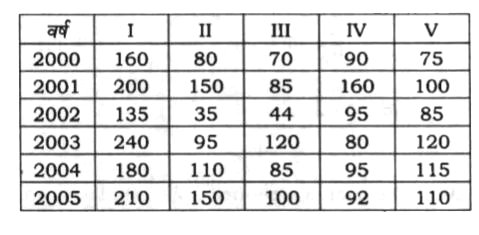
The ratio of percentage drop in total production in 2004 compared to 2001 to that in 2000 compared to 2001, is:
View SolutionConsider the following data with regard to production of cars (in lakhs) :
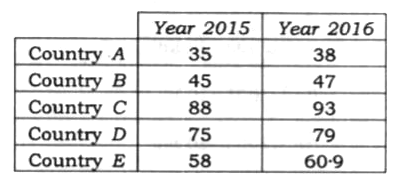
In which of the countries, the production of cars has increased by more than or equal to 5% in 2016 over 2015?
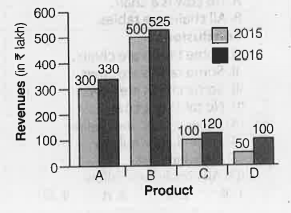
View SolutionThe graph shows revenues (in RS lakh) from selling for different products (A, B,C, D) by thecertain company.Study the diagram and answer the following
Revenues from which product were the least in both the years 2015 and 2016?
View SolutionFrom the following data on the cost of production of a firm, calculate (i) AFC and (ii) AVC of producing three units.

View SolutionFrom the following data on the cost of production of a firm, calculate : (i) AFC and (ii) AVC of producing 9 units.

View SolutionStudy the following graph which shows the production (in thousands) of different items, and answer these questions.
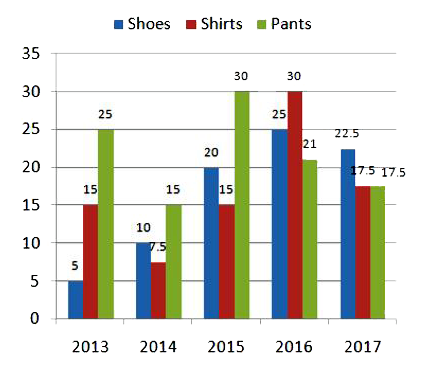
The total number of all products produced by the company in the year 2014 and 2016 together is:
View Solution
