The following figure shows the proportion of the population for four years in various age groups in percentage :
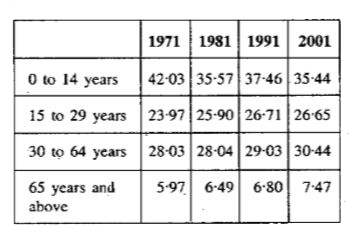
Based on the information provided above identify the state of dependency ratio from 1971 to 2001.
It has increased
It has decreased
It has remained constant
It has fluctuating tendency
Step by step video solution for The following figure shows the proportion of the population for four years in various age groups in percentage : Based on the information provided above identify the state of dependency ratio from 1971 to 2001. by General Knowledge experts to help you in doubts & scoring excellent marks in Class 14 exams.
Updated on:21/07/2023Similar Questions
The following graph shows the production of cement (in lakh tons) of four factories A, B, C and D over the years
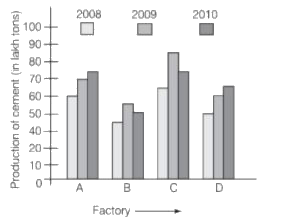
The percentage increase in production of cement by factory B from 2008 to 2009 is about
View SolutionThe following graph shows the production of cement (in lakh tons) of four factories A, B, C and D over the years
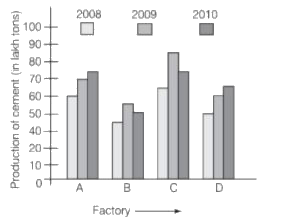
Which of the four factories has recorded the maximum percentage growth in production of cement from 2008 to 2009 ?
View Solution
Knowledge Check
Which one of the following figures represents the working age group of the population? (in years)
A15-65 yearsB15-54 yearsC15-66 yearsD15-59 yearsThe following table showing the percentage of the total population of a state in different age groups. Out of every 50,000 people, find the approximate number of persons below the age of 35?
निम्नलिखित तालिका एक राज्य में अलग-अलग आयु वर्ग की कुल आबादी के प्रतिशत को दर्शाती है |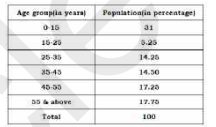
प्रत्येक 50,000 लोगों में से, 35 वर्ष से कम उम्र के लोगों की संख्या (लगभग) ज्ञात करें |A25230B26260C26250D25250In each question below, detailed information of candidate is given. You have to carefully study the information provided in each case and take one of the following courses of actions based on the information and the conditions given above. You are not to assume anything other than the information provided in each question. All these cases are given to you as on 01.12.2013. You have to indicate your decision by marking answers to each question as follows:
Kalyani is an Engineer with 72% marks in Telecommunication. She has just completed 27 yr of age. She has cleared the selection test with 59% marks . She is willing to sign the bond.AIf the case is to be referred to VPBIf the case is to be referred to GMCIf the data provided is not sufficient to take a decisionDIf the candidate is to be selected
The following graph shows the production of cement (in lakh tons) of four factories A, B, C and D over the years
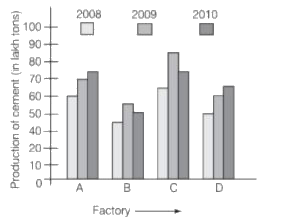
Which of the given factories has recorded the maximum percentage growth in production of cement from 2009 to 2010 ?
View SolutionThe Bar Graph given here shows the population (in crores) of India in various census years. Observe the graph and answer the question based on it.
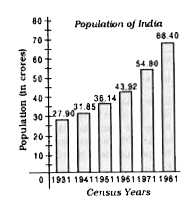
The per cent increase in population from 1971 to 1982 is
View SolutionIn each question below, detailed information of candidate is given. You have to carefully study the information provided in each case and take one of the following courses of actions based on the information and the conditions given above. You are not to assume anything other than the information provided in each question. All these cases are given to you as on 01.12.2013. You have to indicate your decision by marking answers to each question as follows:
Nishant is an Electronics Engineer passed out in June, 2010 at the age of 22 yr. Since, then he is working as a Programmer in a software company. He has passed the selection test with 66% marks and is willing to sign the bond.
View SolutionIn each question below, detailed information of candidate is given. You have to carefully study the information provided in each case and take one of the following courses of actions based on the information and the conditions given above. You are not to assume anything other than the information provided in each question. All these cases are given to you as on 01.12.2013. You have to indicate your decision by marking answers to each question as follows:
Ms. Suneeta is an IT Engineer with 60% marks at graduation as well as in selection test. She is working as a Software Engineer for last 3yr after completing engineering degre and has completed 27yr of age. She is willing to sign the bond of 50000.
View SolutionThe following graph shows the data of the number of candidates that appeared and qualified for a competitve exam from the colleges A , B,C,D,E .
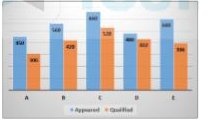
Based on the information , the difference between the percentage of students that qualified , from the colleges B and D is :
View Solution
