The bar graph as shown below gives information about the sale and profit details of a departmental. store during the years from 2001-08. Study the graph carefully and answer the questions asked here under.
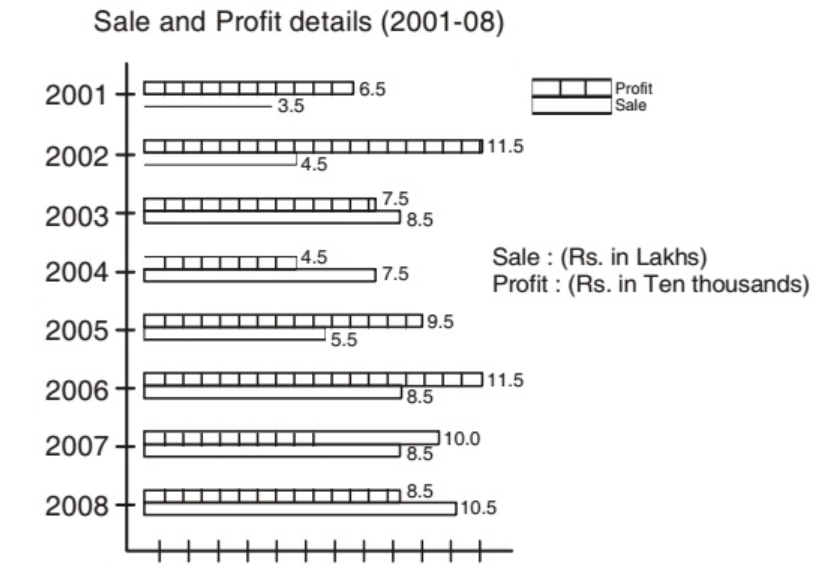
During which year between 2001 to 2006 profit made by the store as compared to the previous year was more than 100% ?
2008
2007
2005
2003
The correct Answer is:C
Step by step video & image solution for The bar graph as shown below gives information about the sale and profit details of a departmental. store during the years from 2001-08. Study the graph carefully and answer the questions asked here under. During which year between 2001 to 2006 profit made by the store as compared to the previous year was more than 100% ? by Maths experts to help you in doubts & scoring excellent marks in Class 14 exams.
Updated on:21/07/2023Topper's Solved these Questions
Similar Questions
Read the following graph carefully and answer the questions given below.
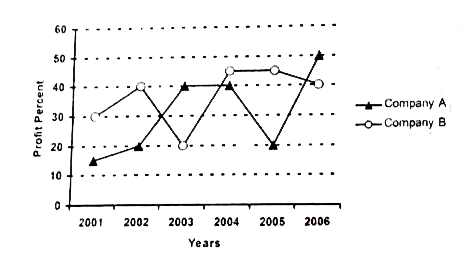
In which year the average of the profit percent of the both companies was the maximum ?
View SolutionThe following graph given the annual percent profit earned by a comppany during the period 1996-2001. Study the graph carefully and answer the questions that follow.
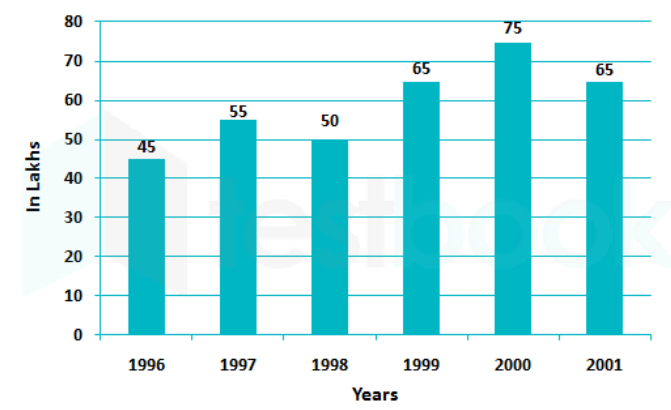
The perofit earned by the company is maximum is the year :
View Solution
Knowledge Check
Study the following graph carefully and answer the questions that follow
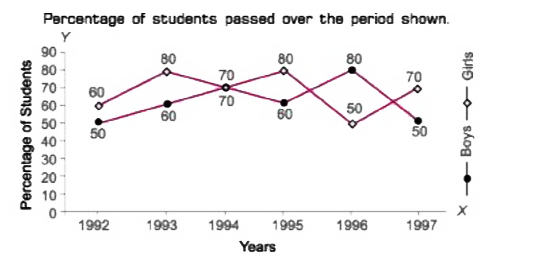
In which of the following years was the improvement of girls maximum as compared to that of previous years ?A1992B1993C1997D1995Study the following table carefully and answer the question given below -----
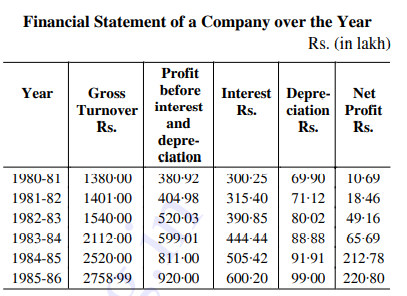
During which year did the 'Net Profit' exceed Rs. 1 crore for the first time ?A1985-86B1984-85C1983-84D1982-83Study the following bar graph and answer the question that follows.
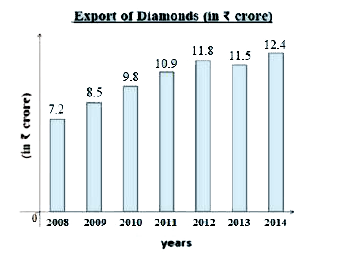
In which year was the maximum percentage increase in diamond exports compared to the previous year?A2014B2009C2010D2012
Study the following graph carefully and answer the questions that
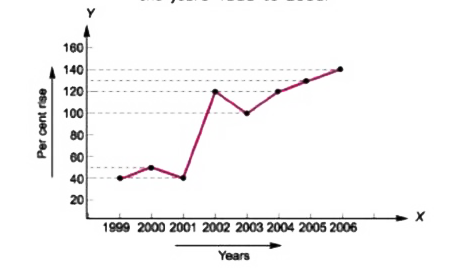
For how many years , the percent rise was more than 100 % ?
View SolutionStudy the graph carefully and answer the questions.
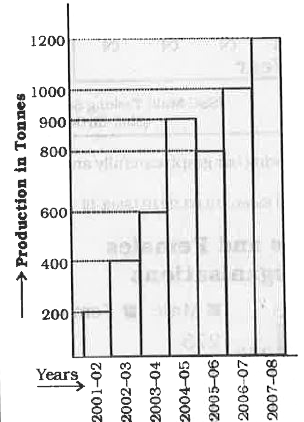
The graph shows production of an item (in tonnes) during certain years
The year in which productions increased the lowest as compared to the previous year is
View SolutionStudy the following graph carefully and answer the questions given below it -----
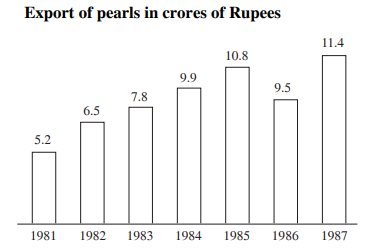
In which year there was maximum percentage increase in export of pearls to that in the previous year ?
View SolutionA graph showing the price of rice in India during the year 2000 to 2003 is given below. Study the graph carefully and answer the questions.
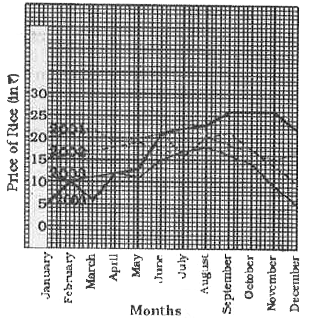
The maximum difference in price between any two years was in the month of
View SolutionStudy the following graph carefully and answer the questions that follow
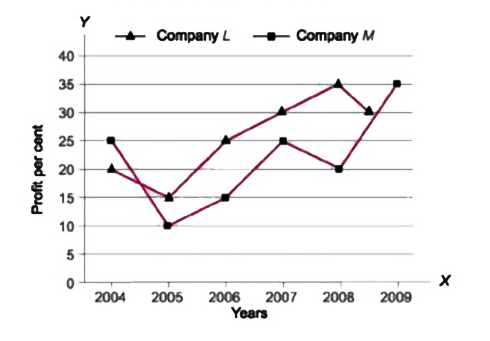
What was the percentage increase in percent rise in profit of company M in the year 2009 from the previous year ?
View Solution