If the population figures are given for each state of India, then the data can be classified as
Qualitative
Quantitative
Chronological
Geographical
To classify the population figures given for each state of India, we can analyze the types of data available. Here’s a step-by-step solution:
Step 1: Understand the Types of Data
Data can be classified into various categories such as qualitative, quantitative, chronological, and geographical.
Step 2: Identify the Nature of Population Data
Population figures represent numerical values that indicate the number of people living in each state. This is a measurable quantity.
Step 3: Classify the Data
- Qualitative Data: This type includes non-numeric categories such as sex, religion, or literacy levels.
- Quantitative Data: This includes numeric data that can be measured, such as height, weight, or population figures.
- Chronological Data: This type involves time-related data such as years, months, or dates.
- Geographical Data: This includes data related to locations such as states, cities, or countries.
Step 4: Determine the Correct Classification
Since the population figures are numeric and represent measurable quantities, they fall under the category of Quantitative Data.
Conclusion
Therefore, the correct classification for the population figures given for each state of India is Option B: Quantitative.
---
Data can be classified into various categories such as qualitative, quantitative, chronological, and geographical.
Population figures represent numerical values that indicate the number of people living in each state. This is a measurable quantity.
- Qualitative Data: This type includes non-numeric categories such as sex, religion, or literacy levels.
- Quantitative Data: This includes numeric data that can be measured, such as height, weight, or population figures.
- Chronological Data: This type involves time-related data such as years, months, or dates.
- Geographical Data: This includes data related to locations such as states, cities, or countries.
Since the population figures are numeric and represent measurable quantities, they fall under the category of Quantitative Data.
Therefore, the correct classification for the population figures given for each state of India is Option B: Quantitative.
Similar Questions
Knowledge Check
Which is the higest populated state of India ?
AMadhya PradeshBUttar PradeshCBiharDMaharashtraThe four most populous States of India are :
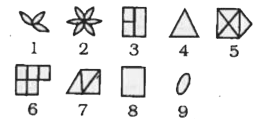
AUttar Pradesh, Maharashtra, Bihar, West BengalBUttar Pradesh, Maharashtra, Rajasthan, GujaratCUttar Pradesh, Bihar, Andhra Pradesh, Tamil NaduDMaharashtra, Karnataka, Madhya Pradesh, Tamil NaduA series of figures is given which can be grouped into classes. Select the group from the given responeses into which the figures can be classified :
 A(a) 1 2 3, 4 8 9, 5 7 6B(b) 4 5 7, 3 1 2, 7 8 9C(c) 1 3 7, 8 9 4, 2 5 6D(d) 3 5 6, 8 7 4, 9 1 2
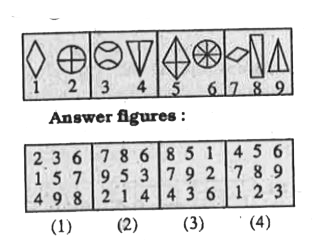
In the following question, a series of figures are given which can be grouped into classes. From the responses, select the groups into which the figures can be classified.

View SolutionIn Which states of India does half of India's population live?
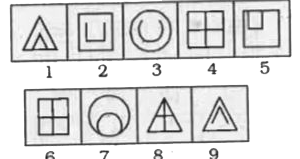
View SolutionA series of figure are given, and these can be grouped into classes. Select from amongst the alternatives one set of group into which the figures can be classified ?

View SolutionThe age groups in a population are classified by
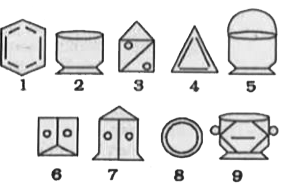
View SolutionA series of figures is given which can be classified into groups. Select from the alternatives one set of groups into which the figures can be classified.

View Solution
