Consider the following data :
1. Number of complaints lodged due to road accidents in a State within a year for 5 consecutive years
2. Budgetary allocation of the total available funds to the various items of expenditure
Which of the above data is/are suitable for representation of a pie diagram?
1 only
2 only
Both 1 and 2
Neither 1 nor 2
Step by step video & image solution for Consider the following data : 1. Number of complaints lodged due to road accidents in a State within a year for 5 consecutive years 2. Budgetary allocation of the total available funds to the various items of expenditure Which of the above data is/are suitable for representation of a pie diagram? by Maths experts to help you in doubts & scoring excellent marks in Class 14 exams.
Similar Questions
Consider the following types of data :
1. Marks of students who appeared for a test of 100 marks.
2. Collar sizes of 200 shirts sold in a week.
3. Monthly incomes of 250 employees of a factory.
For which of the above data, mode is a suitable measure of central tendency?View SolutionConsider the following statement:
1. No peson is eligible for appointment as Governo unless he has completed the age of thirty years.
2. The same person can be appointed as Governor for three states.
Which of the statement given above is /are correct ?View Solution
Knowledge Check
- Question 1 - Select One
Consider the following statements in respect of histogram :
1. The histogram is a suitable representation of a frequency distribution of a continuous variable.
2. The area included under the whole histogram is the total frequency.
Which of the above statements is/are correct?A1 onlyB2 onlyCBoth 1 and 2DNeither 1 nor 2 - Question 2 - Select One
Consider the following statements :
1. Pie diagrams are suitable for catagorical data.
2. The arc length of a sector of a pie diagram is proportional to the value of the component represented by the sector.
Which of the statements given above is/are correct/A1 onlyB2 onlyCBoth 1 and 2DNeither 1 nor 2 - Question 3 - Select One
Consider the following statements in respect of a histogram:
1. The histogram consists of vertical rectangular bars with a common base such that there is no gap between consecutive bars.
2. The height of the rectangle is determined by the frequency of the class it represents.
Which of the statements given above is/are correct?AOnly IIBOnly IICBoth I and IIDNeither I nor 2
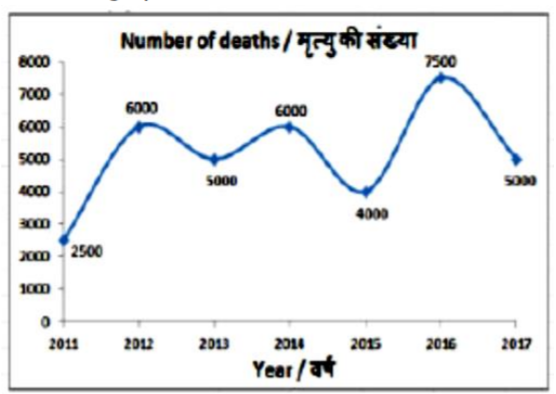
The line graph shows the number of deaths due to road accidents in a certain state. Study the diagram and answer the following questions.

In which year were the number of deaths lesser than that of the previous year?View SolutionThe line graph shows the number of deaths due to road accidents in a certain state. Study the diagram and answer the following questions.

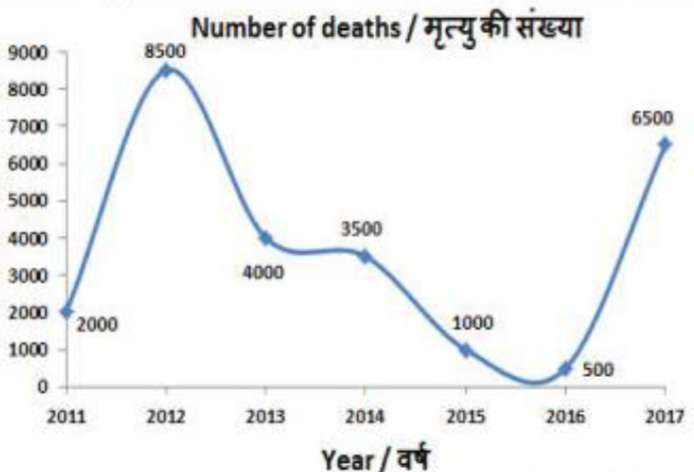
What was the difference in the number of deaths between the years 2011 and 2013?View SolutionThe line graph shows the number of deaths due to rail accidents in a certain state. Study the diagram and answer the following questions.

In which year was the number of deaths greater than that of the previous year?View SolutionThe line graph shows the number of deaths due to rail accidents in a certain state. Study the diagram and answer the following questions.

In which year were the number of details greater than that of the previous year?View SolutionConsider the following measures of central tendency for a set of N number :
1. Arithmetic mean
2. Geometric mean
Which of the above uses/use all the datA ?View Solution

