Read the following and answer the questions given below:
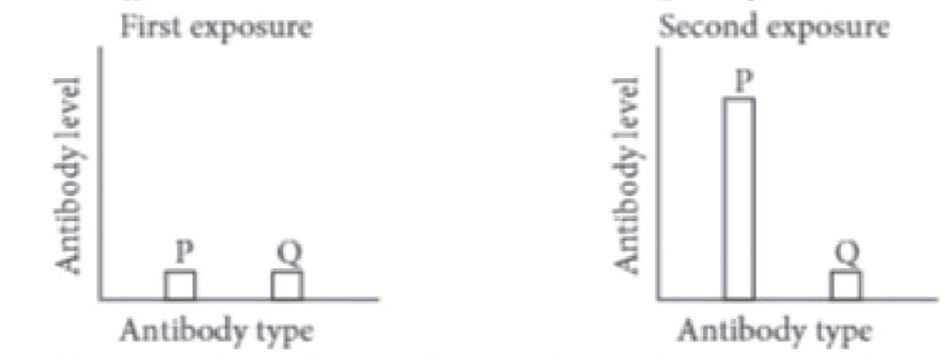
In a study to test a new vaccine against a viral disease, mouse model testing is done. In this process, mice were vaccinated and their blood samples were tested. Mice developed mild disease symptoms. After few days those mice were again infected with the virus. This time they did not show any disease symptoms. Their blood samples were tested. Two graphs show antibody concentration for the first and second infection in mice blood.
Based on the above information answer the following questions.
P and Q in the given graphs indicate
IgM and IgG respectively
IgG and IgM respectively
IgG and IgE respectively
IgM and IgA respectively
The correct Answer is:B
Step by step video & text solution for Read the following and answer the questions given below: In a study to test a new vaccine against a viral disease, mouse model testing is done. In this process, mice were vaccinated and their blood samples were tested. Mice developed mild disease symptoms. After few days those mice were again infected with the virus. This time they did not show any disease symptoms. Their blood samples were tested. Two graphs show antibody concentration for the first and second infection in mice blood. Based on the above information answer the following questions. P and Q in the given graphs indicate by Biology experts to help you in doubts & scoring excellent marks in Class 12 exams.
Updated on:21/07/2023समान प्रश्न
Testes live in mice
View SolutionTransgenic mice are being used to test the safety of:
View SolutionWhen mice were injected with a mixture of bacteria, avirulent pneumococcus bacteria and heat killed virulent, the mice were found dead due to pneumococcus infection. Why ?
View SolutionFive mice in a stable population of 500 are intentionally infected with a contagious disease to test a theory of epidemic spred that postulates the rate of change in the infected population is proportional to the product of the number of mice who have the disease with the number that are disease free. Assuming the theory is correct, how long will it take half the popullation to contract the disease?
View SolutionAssertion: Transgenic mice are being used to test the safety of the polio vaccine
Reason :They could not replace the use of monkeys to test the safety of batches of the vaccine
View SolutionAssertion: Transgenic mice are being used to test the safety of the polio vaccine
Reason :They could not replace the use of monkeys to test the safety of batches of the vaccine
View SolutionAssertion: Transgenic mice are being developed for use in testing the safety of vaccines. Reason: If successful and found reliable they could replace the use of monkeys to test the safety of batches of the vaccine.
View SolutionFive mice in a stable population of 500 are intentionally infected with a contagious disease to test a theory of epidemic spred that postulates the rate of change in the infected population is proportional to the product of the number of mice who have the disease with the number that are disease free. Assuming the theory is correct, how long will it take half the popullation to contract the disease?
View Solution
