The following table gives the details of five commodities A, B, C, D and E with the quantity required and their costs for a family in a month. Study the table and answer the questions that follow.
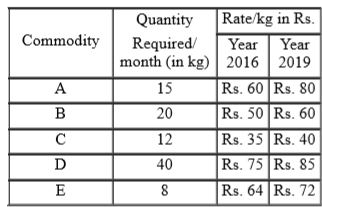
The percentage of increase (per kg) in the rate of commodity D from 2016 to 2019 is:
5%
13.33%
38.24%
22.17%
The correct Answer is:B
Step by step video, text & image solution for The following table gives the details of five commodities A, B, C, D and E with the quantity required and their costs for a family in a month. Study the table and answer the questions that follow. The percentage of increase (per kg) in the rate of commodity D from 2016 to 2019 is: by Maths experts to help you in doubts & scoring excellent marks in Class 14 exams.
Updated on:21/07/2023Similar Questions
The following table gives the details of five commodities A,B,C,D and E with quantity required and their cost for a family in a month. Study the table and answer the questions that follow. The total amount spent on the five commodities by the family in the year 2019 is:
निम्नलिखित तालिका पाँच वस्तुओं A, B, C, D तथा E के बारे में बताती है कि एक महीने में एक परिवार को उनकी कितनी मात्रा की आवश्यकता है तथा उनकी लागत कितनी है | इस तालिका का अध्ययन करें तथा फिर पूछे गए प्रश्नों के उत्तर दें |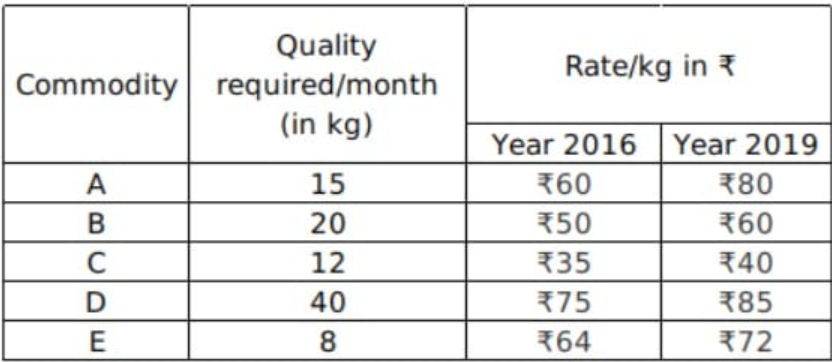
इस परिवार के द्वारा वर्ष 2019 में पाँचों वस्तुओं पर कुल कितनी राशि खर्च की गयी थी ?
View SolutionThe following table gives the details of five commodities A,B,C,D and E with quantity required and their cost for a family in a month. Study the table and answer the questions that follow.
निम्नलिखित तालिका पाँच वस्तुओं A, B, C, D तथा E के बारे में बताती है कि एक महीने में एक परिवार को उनकी कितनी मात्रा की आवश्यकता है तथा उनकी लागत कितनी है | इस तालिका का अध्ययन करें तथा फिर पूछे गए प्रश्नों के उत्तर दें |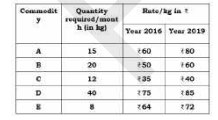 The amount spent extra on commodities B and C in the year 2019 as compared to that in the
year 2016 is:
वर्ष 2016 की तुलना में वर्ष 2019 में वस्तु B तथा C पर कितनी अतिरिक्त राशि खर्च की गयी है ?
View Solution
Knowledge Check
Direction∶ The given table shows the number (in thousands) of cars of five different models A, B, C, D and E produced during years 2012-2017. Study the table and answer the question that follow.
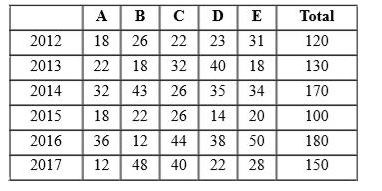
The percentage decrease in the production of which type of car in 2017, with reference to 2016, was the maximum?ADBCCADEStudy the following table and answer the questions based on it.The percentage increase in the export of the commodity from the year 1998 to 1999 was the lowest from which port?
AABBCCDDStudy the following table and answer the questions based on it.The percentage increase in the export of the commodity from the year 1998 to 1999 was the highest from which port?
AABBCCDD
The following table gives the details of five commodities A,B,C,D and E with quantity required and their cost for a family in a month. Study the table and answer the questions that follow.
निम्नलिखित तालिका पाँच वस्तुओं A, B, C, D तथा E के बारे में बताती है कि एक महीने में एक परिवार को उनकी कितनी मात्रा की आवश्यकता है तथा उनकी लागत कितनी है | इस तालिका का अध्ययन करें तथा फिर पूछे गए प्रश्नों के उत्तर दें |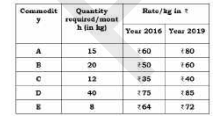 The ratio of the total amount spent on A and D commodities in the year 2019 is:
वर्ष 2019 में A और D वस्तुओं पर खर्च की गयी कुल राशि का अनुपात कितना है ?
View SolutionThe given table shows the number (in thousands) of cars of five different models A, B, C, D and E produced during years 2012-2017. Study the table and answer the questions that follow.
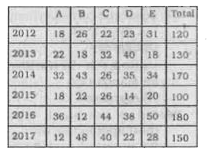
The percentage increase in the total cars in 2016 over 2012, is:
View SolutionThe given table shows the number (in thousands) of cars of five different models A, B, C, D and E produced during years 2012-2017. Study the table and answer the questions that follow.
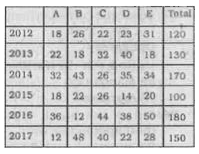
The percentage decrease in the production of which type of car in 2017, with reference to 2016, was the maximum
View SolutionStudy the following table and answer the questions based on it.The percentage increase in the export of the commodity from the year 1998 to 1999 was the highest from which port?
View SolutionStudy the following table carefully and answer the questions given below it-
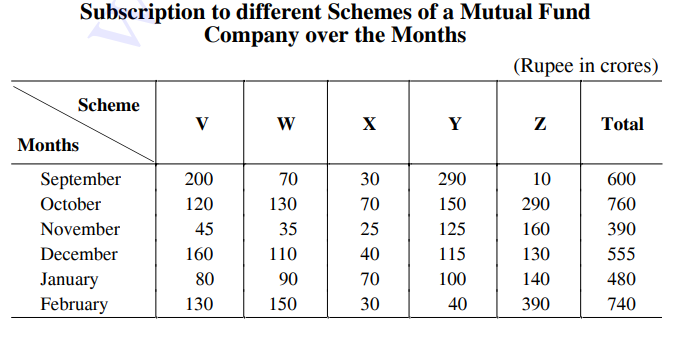
What is the percentage increase in the subscription to Z scheme from January to February ?
View Solution
