Study the following table chart carefully and answer the questions below:
The chart shows the number of employees in various departments in 5 companies.

Find the average number of employees from the technical department hired by all companies taken together.
201
205
102
202
The correct Answer is:D
Step by step video, text & image solution for Study the following table chart carefully and answer the questions below: The chart shows the number of employees in various departments in 5 companies. Find the average number of employees from the technical department hired by all companies taken together. by Maths experts to help you in doubts & scoring excellent marks in Class 14 exams.
Updated on:21/07/2023Similar Questions
Study the following line chart carefuly and answer the question given below. The following line chart represents the number of employee recruited in different years in a company.
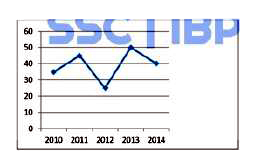
What was the ratio of number of employees recruited in year 2011 to that in year 2013?
View SolutionStudy the following line chart carefuly and answer the question given below. The following line chart represents the number of employee recruited in different years in a company.
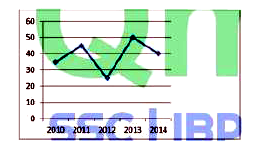
The number of employees recruited in year 2012 was what percent of the number of emplyees recruited in year 2014.
View Solution
Knowledge Check
Study the following line chart carefully and answer the questions given below it. The following line chart represents the number of employees recrulted in different years in a company.
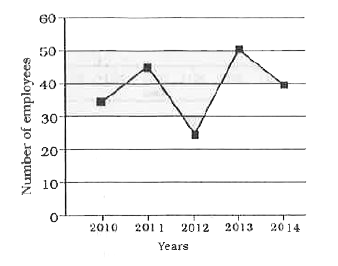
If the total number of employees before the year 2010 was 640, then the total number of employees after 2014 was :A820B835C815D845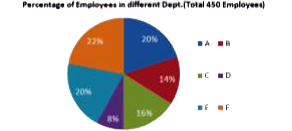
In the given pie-chart. what is the number of employees working in department A?A80B85C90D960Study the following line chart carefully and answer the questions given below it. The following line chart represents the number of employees recrulted in different years in a company.
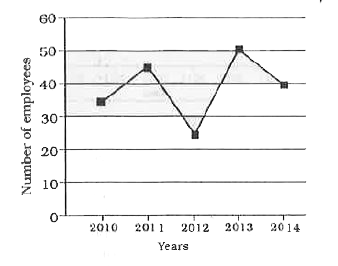
What was the ratio of number of employees recruited in the year 2011 to that in the year 2013?A2:3B9:10C10:9D5:9
Study the pie chart and answer the question
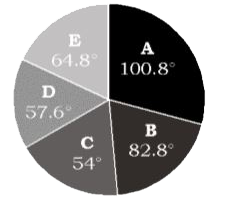
The total number of employees of the company in offices D and E in what percentage more than the number of employees in office A?
View SolutionStudy the following line chart carefully and answer the questions given below it. The following line chart represents the number of employees recrulted in different years in a company.
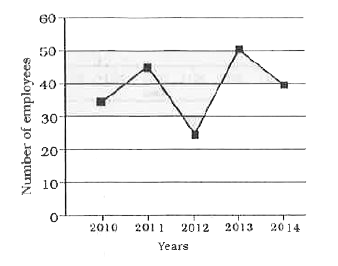
The number of employees recruited in the year 2012 was what percent of the number employees recruited in the year 2014 ?
View SolutionStudy the following line chart carefully and answer the questions given below it. The following line chart represents the number of employees recrulted in different years in a company.
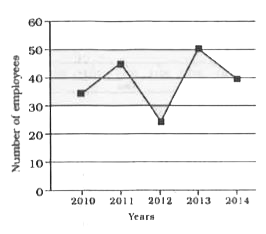
The number of employees recruited in 2015 was 40% more than that recruited in 2014. How many employees were recruited in 2015?
View SolutionStudy the following line chart carefully and answer the questions given below it. The following line chart represents the number of employees recrulted in different years in a company.
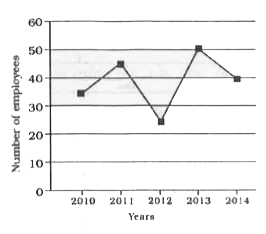
If the number of employees before 2010 was 640, what was percentage increase in 2010?
View SolutionStudy the following graph carefully to answer the questions given below.
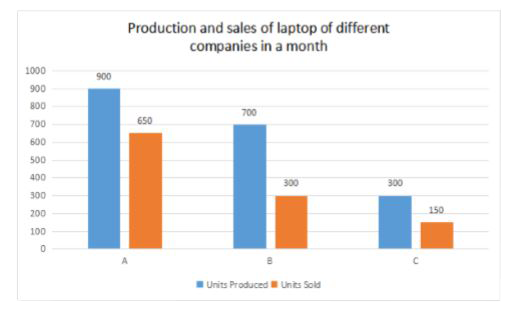
What is the average number of Units of laptop sold by all the Companies together?
View Solution
