Given below is the data of the sale of Washing Machine of a company in four cities in a year. The record is based on the quarterly sale

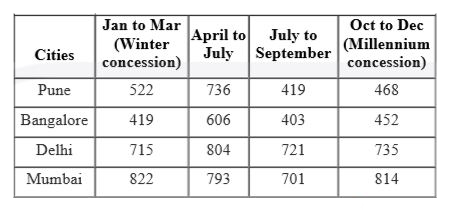
What is the percentage of the Washing Machine sold during July to Sept quarterly? (approx)
19.9%
28.4%
20.35
22.1%
The correct Answer is:D
Step by step video, text & image solution for Given below is the data of the sale of Washing Machine of a company in four cities in a year. The record is based on the quarterly sale What is the percentage of the Washing Machine sold during July to Sept quarterly? (approx) by Maths experts to help you in doubts & scoring excellent marks in Class 14 exams.
Similar Questions
A washing machine is available for Rs. 7950, including sales tax. If the rate of sales tax is 6%, find the list price of the washing machine.
View SolutionThe bar graph given below shows the data of the production of paper (in lakh tonnes) by three different companies P, Q and R over the years.
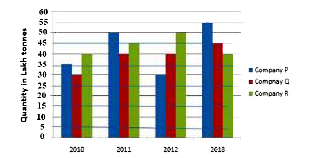
What is the percentage increase in the productionby company Q from 2010 to 2013?View Solution
Knowledge Check
- Question 1 - Select One
Given below is the data of the sale of Washing Machine of a company in four cities in a year. The record is based on the quarterly sale.
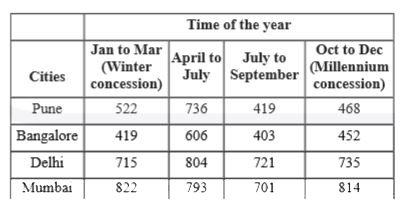
How much turnover did the company receive during the period Oct to Dec?A2469B2458C2456D2459 - Question 2 - Select One
Given below is the data of the sale of Washing Machine of a company in four cities in a year. The record is based on the quarterly sale.
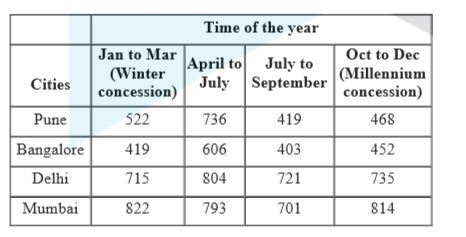
What approximately is Mumbai’s contribution in the annual sale?A27.8%B33.3%C30.9%D31.5% - Question 3 - Select One
Given below is the data of the sale of Washing Machine of a company in four cities in a year. The record is based on the quarterly sale.
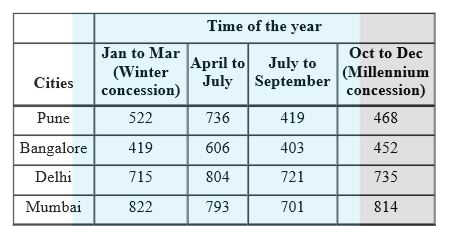
The turnover of Jan to March is how much more than the turnover of Oct to Dec.A11B15C14D9
The bar graph given below shows the data of the production of paper (in lakh tonnes) by three different companies P, Q and R over the years.
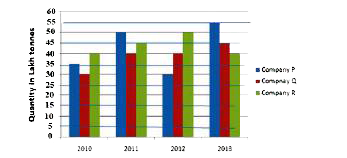
What is the ratio of the average production by company P during the period 2010 to 2013 to the average production by company R during the same period?View SolutionThe line chart given below shows the sales (in crores) of a company for the years 2009 to 2016
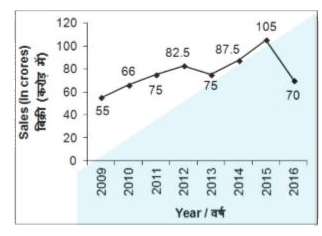
What is the average sale of the company from year 2009 to 2015?View SolutionThe pie chart given below shows sale of different types of cars in a city for a given year. The total sale of cars in the city is 6,00,000.
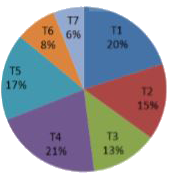
What is the difference in the number of cars sold of type T5 and T1?View SolutionThe line chart given below shows the sales (in crores) of a company for the years 2009 to 2016
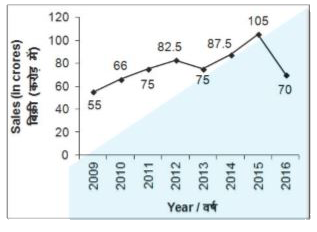
What is the percentage change in the company sales from year 2014 to year 2016?View SolutionFollowing is a data regarding export and import of a company over the years. Answer the question given below.
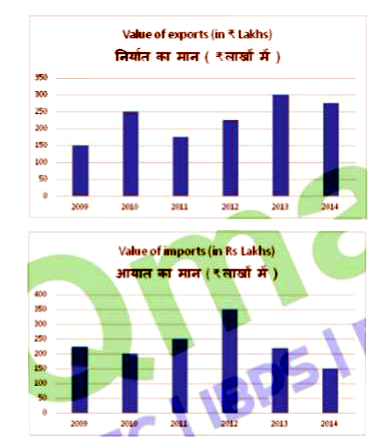
What was the percentage increase in imports fromyear 2011 to 2012?View Solution

