Potential energy vs. time given U=kX22.Plot graph of U vs. t.
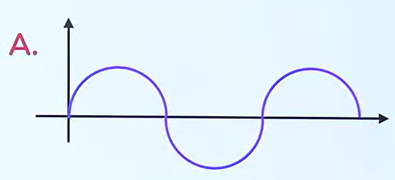
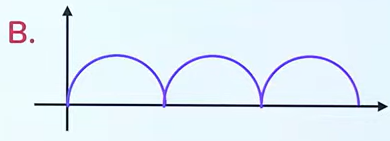
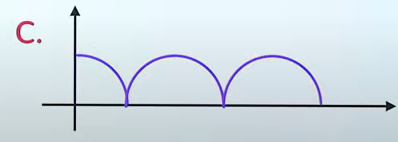
none
To plot the graph of potential energy (U) versus time (t) given the potential energy formula U=12kx2, we need to relate the displacement x to time t in the context of simple harmonic motion (SHM). Here’s a step-by-step solution:
Step 1: Understand the relationship between displacement and time in SHM
In SHM, the displacement x can be expressed as:
x(t)=Asin(ωt)
where:
- A is the amplitude of the motion,
- ω is the angular frequency.
Step 2: Substitute the expression for x(t) into the potential energy formula
We substitute x(t) into the potential energy equation:
U(t)=12k(Asin(ωt))2
This simplifies to:
U(t)=12kA2sin2(ωt)
Step 3: Identify the form of the potential energy function
The potential energy as a function of time is now:
U(t)=12kA2sin2(ωt)
This indicates that the potential energy varies with the square of the sine function.
Step 4: Analyze the sine squared function
The sine squared function, sin2(ωt), oscillates between 0 and 1. Therefore, U(t) will oscillate between:
- Minimum value: Umin=0 (when sin(ωt)=0)
- Maximum value: Umax=12kA2 (when sin(ωt)=1)
Step 5: Sketch the graph of U(t)
The graph of U(t) versus t will resemble a sine squared wave:
- It will touch the time axis (U=0) at intervals of πω (when sin(ωt)=0).
- It will reach its maximum value 12kA2 at intervals of π2ω (when sin(ωt)=1).
- The graph will be periodic with a period of 2πω.
Step 6: Finalize the graph characteristics
- The graph will be a continuous curve that oscillates smoothly between the minimum and maximum values.
- The shape of the graph will be similar to a parabola opening upwards, but it will not have sharp corners or vertical tangents.
Final Answer
The graph of potential energy U versus time t is a sine squared wave oscillating between 0 and 12kA2.
---
In SHM, the displacement x can be expressed as:
x(t)=Asin(ωt)
where:
- A is the amplitude of the motion,
- ω is the angular frequency.
We substitute x(t) into the potential energy equation:
U(t)=12k(Asin(ωt))2
This simplifies to:
U(t)=12kA2sin2(ωt)
The potential energy as a function of time is now:
U(t)=12kA2sin2(ωt)
This indicates that the potential energy varies with the square of the sine function.
The sine squared function, sin2(ωt), oscillates between 0 and 1. Therefore, U(t) will oscillate between:
- Minimum value: Umin=0 (when sin(ωt)=0)
- Maximum value: Umax=12kA2 (when sin(ωt)=1)
The graph of U(t) versus t will resemble a sine squared wave:
- It will touch the time axis (U=0) at intervals of πω (when sin(ωt)=0).
- It will reach its maximum value 12kA2 at intervals of π2ω (when sin(ωt)=1).
- The graph will be periodic with a period of 2πω.
- The graph will be a continuous curve that oscillates smoothly between the minimum and maximum values.
- The shape of the graph will be similar to a parabola opening upwards, but it will not have sharp corners or vertical tangents.
The graph of potential energy U versus time t is a sine squared wave oscillating between 0 and 12kA2.
Topper's Solved these Questions
- JEE MAIN 2021BOOK - JEE MAINS PREVIOUS YEARCHAPTER - JEE MAIN 2021EXERCISE - SECTION-A
80 Videos
- JEE MAIN 2021BOOK - JEE MAINS PREVIOUS YEARCHAPTER - JEE MAIN 2021EXERCISE - SECTION-B
40 Videos
- JEE MAINBOOK - JEE MAINS PREVIOUS YEARCHAPTER - JEE MAINEXERCISE - All Questions
473 Videos
- JEE MAIN 2022BOOK - JEE MAINS PREVIOUS YEARCHAPTER - JEE MAIN 2022EXERCISE - Question
492 Videos
Similar Questions
Let gravitational potential energy U is given by U=A√xB+x2, where x is distance. The dimensional formula of A/B is
View SolutionThe potential energy of a particle of mass 2kg moving along the x-axis is given by U(x)=4x2−2x3( where U is in joules and x is in meters). The kinetic energy of the particle is maximum at
View Solution
Knowledge Check
In S.H.M., potential energy (U) V/s, time (t) . Graph is
A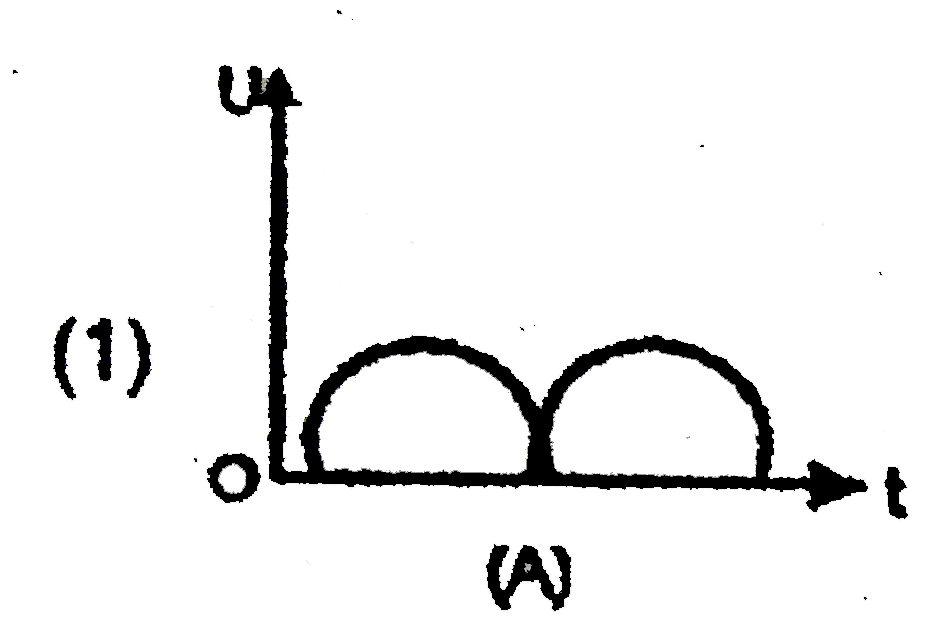 B
B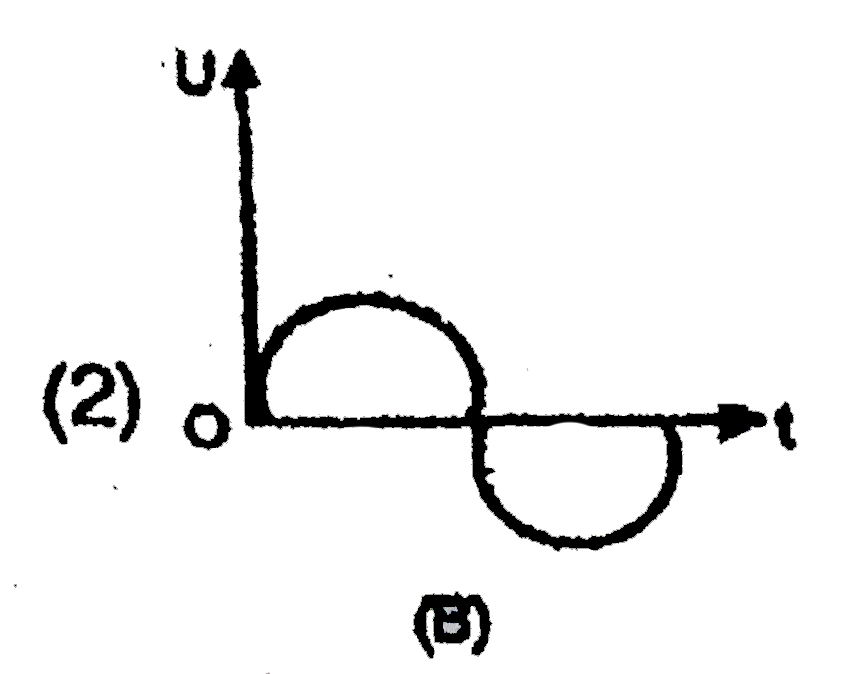 C
C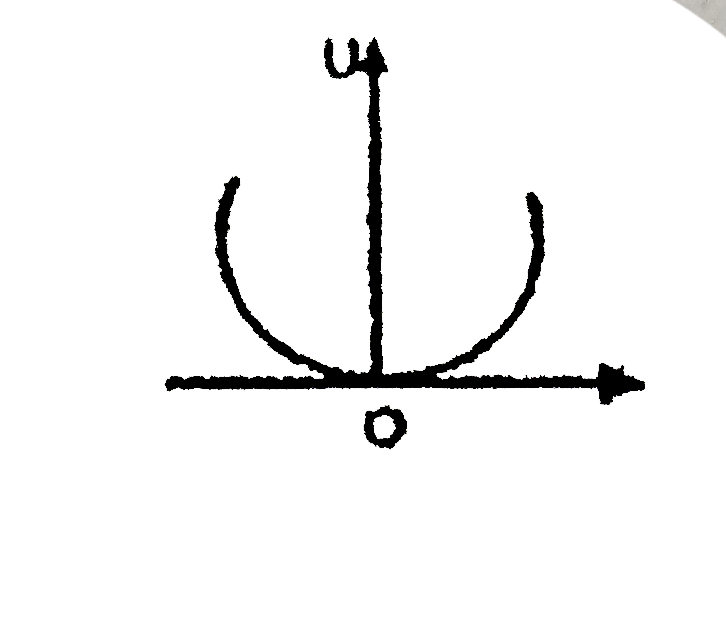 D
D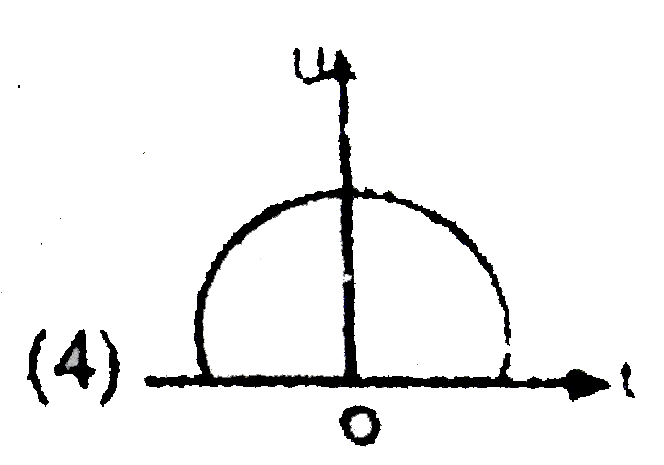
The potential energy of a body is given by U=9x2−2x The position at which its speed can be maximum is.
Ax=+3mBx=−3mCx=9mDx=−9mThe following plot shows the variation of potential energy (U) of a system versus position (x). From the graph we can interpret that :
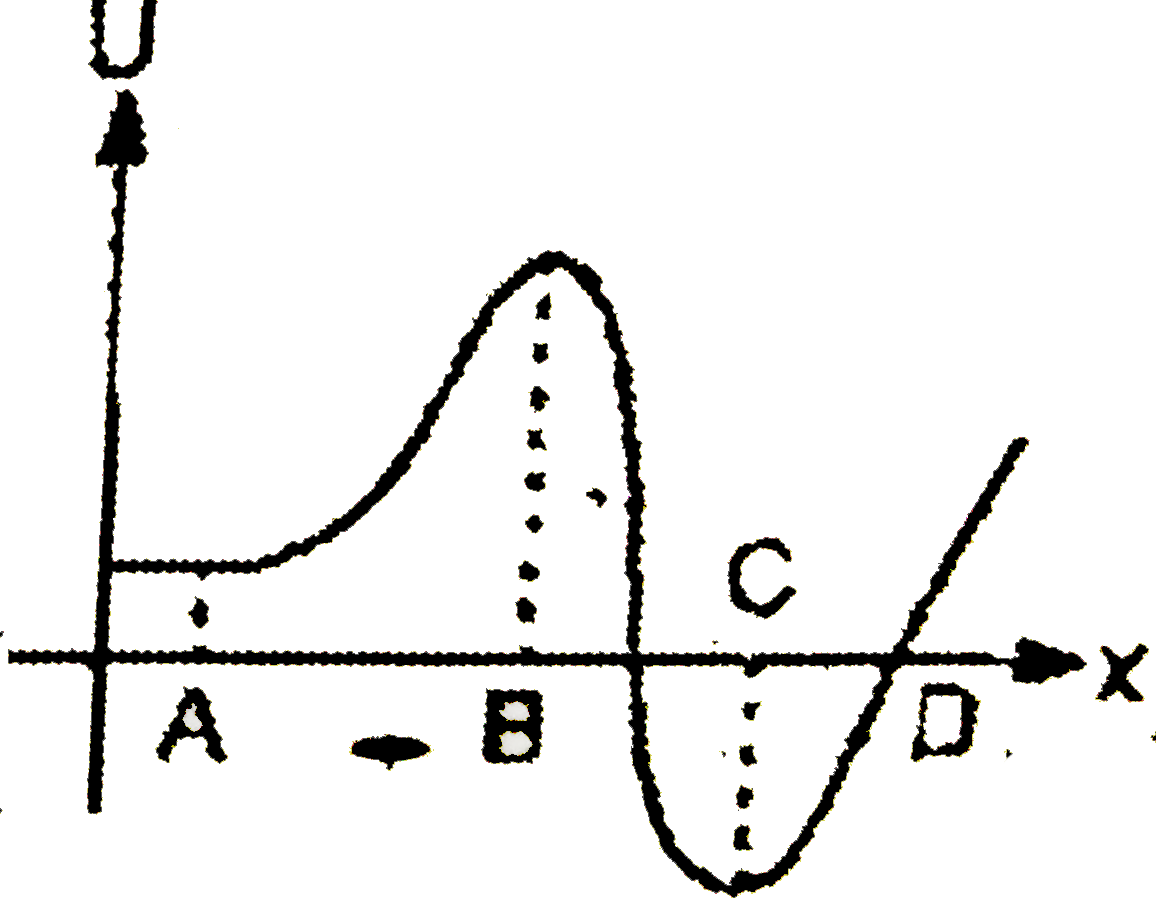 APoint D is position of neutral equilibriumBPoint B is position of unstable equilibriumCPoint C is position of stable equilibriumDPoint A is position of neutral equilibrium
For example , at what displacement the kinetic is eqal to the potential energy ?
Hint :U=12kx2,K=12(A2−x2)
U=K
View SolutionIf a particle starts moving with initial velocity u=1ms−1 and acceleration a=2ms−2, the veloctiy of the particle at any time is given by v=u+at=1+2t. Plot the velocity-time graph of the particle.
View SolutionWhen a spring is compressed by a distance 'x', the potential energy stored is U1. It is further compressed by a distance '2x', the increase in potential energy is U2. The ratio of U1:U2
View SolutionThe potential energy of a particle is given by formula U=100−5x+100x2,whereU and are .
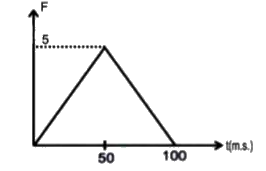
View Solutionmass 1 kg initially at rest is given. What will be the graph of momentum Vs time for the given graph?
View Solution
