The given bar graph represents the number of students admitted in four schools (S1, S2. S3, S4) during two consecutive years 2017 and 2018.
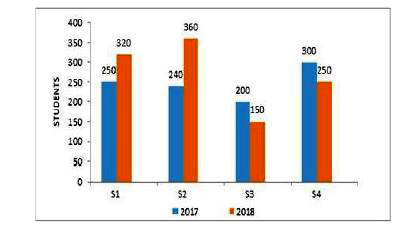
What percentage is the average admission of schools S3 and S4 in 2018 is of the average admission of schools S1 and S2 in 2017?
82.37
81.37
81.63
82.63
The correct Answer is:C
Step by step video & image solution for The given bar graph represents the number of students admitted in four schools (S1, S2. S3, S4) during two consecutive years 2017 and 2018. What percentage is the average admission of schools S3 and S4 in 2018 is of the average admission of schools S1 and S2 in 2017? by Maths experts to help you in doubts & scoring excellent marks in Class 14 exams.
Updated on:21/07/2023Similar Questions
The given bar graph represents the number of students admitted in four schools (SI, S2, S3, S4) during two consecutive vears 2017 and 2018.
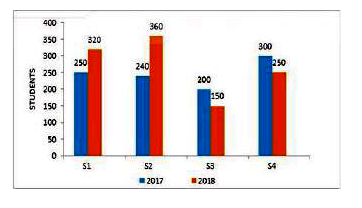
The total number of students admitted in school S1 for both years is approximately what percent of total student admitted in school S2 for both years?
View SolutionThe given bar graph represents the number of students admitted in four schools (S1, S2, S3, S4) during two consecutive years 2017 and 2018.
दिया गया दंड आरेख चार स्कूलों (S1, S2, S3, S4) में लगातार दो साल 2017 और 2018 के दौरान नामांकित छात्रों की संख्या को प्रदर्शित करता है। What is the average number of students admitted to all schools in 2018?
2018 में सभी स्कूलों में दाख़िला लेने वाले छात्रों की औसत संख्या कया है?
View Solution
Knowledge Check
The given bar graph represents the number of students admitted in four schools (S1, S2, S3, S4) during two consecutive years 2017 and 2018.
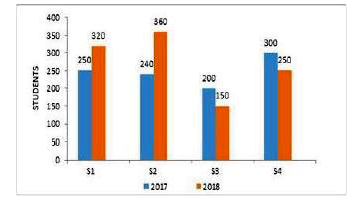
What is the average number of students admitted to all schools in 2018?A280B275C290D270The table given below shows the number of students who have taken admission in school A and B from the years 2010 to 2015.
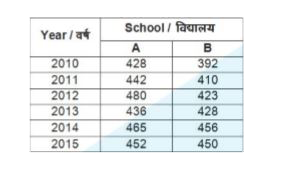
What is the average difference of number of students in school A and B in the given period?Aa)24Bb)27Cc)96Dd)144The given Bar Graph presents the results in terms of the number of students in a school for the five academic years, 2013-2014 to 2017-2018.
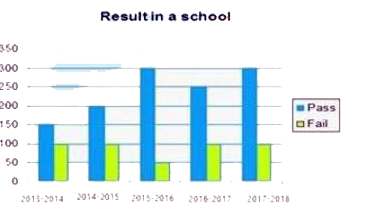
What is the average number of students who passed in the five academic years?Aa) 250Bb)225Cc)300Dd)240
The given bar graph represents the number of students admitted in four schools (S1, S2, S3, S4) during two consecutive years 2017 and 2018.
दिया गया दंड आरेख चार स्कूलों (S1, S2, S3, S4) में लगातार दो साल 2017 और 2018 के दौरान नामांकित छात्रों की संख्या को प्रदर्शित करता है। The ratio between total number of students admitted in the four schools in 2017 to the total
number of students in the four schools in 2018 is:
2017 में चार स्कूलों नामांकित में कुल छात्रों की संख्या और 2018 में चार स्कूलों में नामांकित कुल छात्रों की संख्या के बीच अनुपात है:
View SolutionThe given bar graph represents the number of students admitted in four schools (S1, S2, S3, S4) during two consecutive years 2017 and 2018.
दिया गया दंड आरेख चार स्कूलों (S1, S2, S3, S4) में लगातार दो साल 2017 और 2018 के दौरान नामांकित छात्रों की संख्या को प्रदर्शित करता है। The total number of students admitted in school S3 for both years is approximately what percent of total students admitted in school S2 for both years?
दोनों वर्षों के लिए स्कूल S3 में नामांकित छात्रों की कुल संख्या, दोनों वर्षों के लिए स्कूल S2 में नामांकित कुल छात्रों का कितना प्रतिशत है?
View SolutionThe given bar graph presents the results in terms of the number of students in a school of the five academic years, 2013-2014 to 2017-2018.
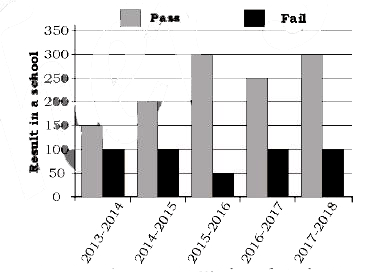
What is the average number of students who passed in the five academic years?
View SolutionIn given bar graph presents the number of students of two schools for six years.
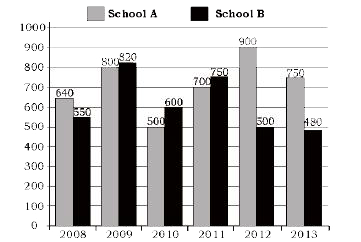
What is the average of total students in schools A and B taken together during the six year period?
View SolutionThe given Bar graph presents the number of students of two schools for six years
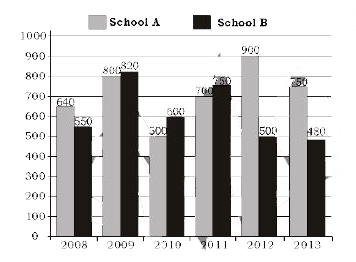
What is the average of the number of students from school A during the six year period?
View Solution
